Unlock a world of possibilities! Login now and discover the exclusive benefits awaiting you.
- Qlik Community
- :
- Forums
- :
- Analytics
- :
- New to Qlik Analytics
- :
- Scatter plot but using dimention for each axis
- Subscribe to RSS Feed
- Mark Topic as New
- Mark Topic as Read
- Float this Topic for Current User
- Bookmark
- Subscribe
- Mute
- Printer Friendly Page
- Mark as New
- Bookmark
- Subscribe
- Mute
- Subscribe to RSS Feed
- Permalink
- Report Inappropriate Content
Scatter plot but using dimention for each axis
Dear Sir and Madam,
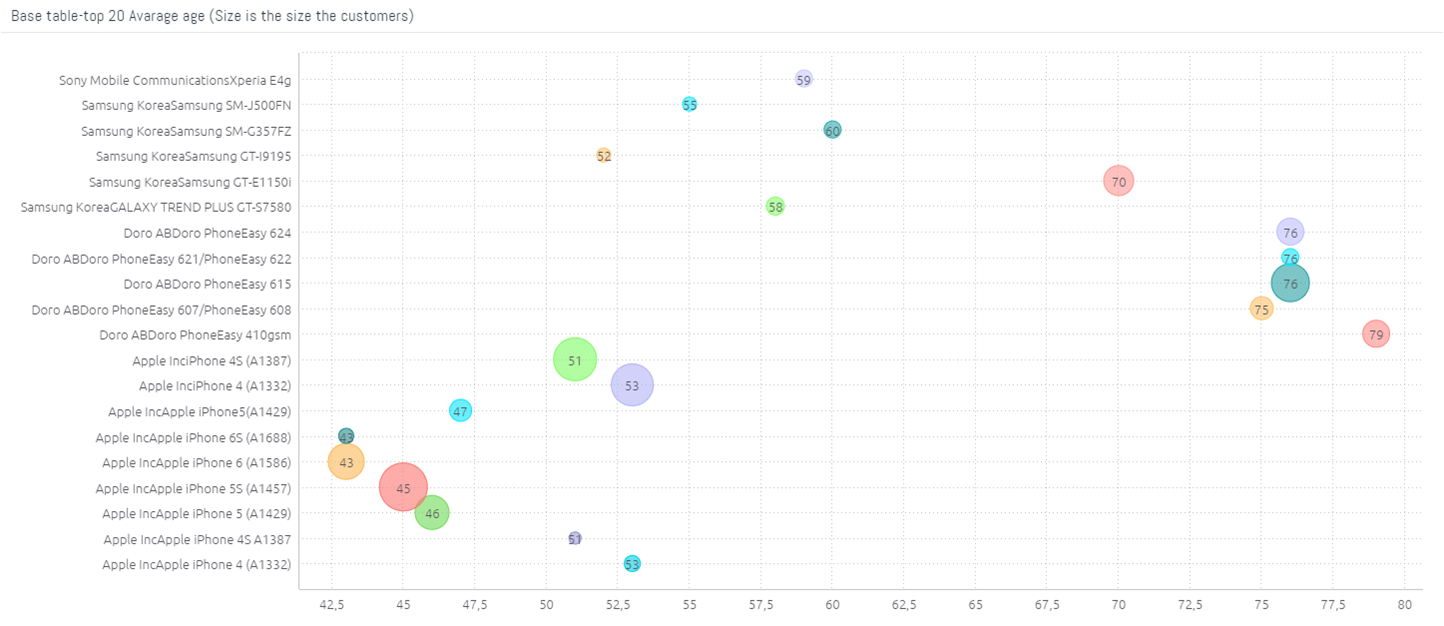
I attached my dataset with Q. And I also attached a graph I want to show as a reference here(using Sisense created this).
I want to do a scatter plot, but use only dimensions rather than measures as X and Y axis
is that possible?
want to use 1. the phone name as the X axis. (only chose the top20 phone name ranked by count(SubID))
and use 2. Age as the Y axis
and could I also add one more dimension as 3. the size of the plot (using the avg(payment))?
----
Seems I can not use the 1. dimension as x, y axis
2. change the size of the bubble size according to the 3nd dimension
- Tags:
- scatter plot