Unlock a world of possibilities! Login now and discover the exclusive benefits awaiting you.
- Qlik Community
- :
- Forums
- :
- Analytics
- :
- New to Qlik Analytics
- :
- Re: Score-Formula based on Avg and Stdev
- Subscribe to RSS Feed
- Mark Topic as New
- Mark Topic as Read
- Float this Topic for Current User
- Bookmark
- Subscribe
- Mute
- Printer Friendly Page
- Mark as New
- Bookmark
- Subscribe
- Mute
- Subscribe to RSS Feed
- Permalink
- Report Inappropriate Content
Score-Formula based on Avg and Stdev
Hello,
I am new and not sure if this is the right section.
First of all I have some variables. For example households, income, etc.
For each of this variables i need a score based on a model. I already have the following in MS Excel 2010:
| Area | Value | Avg | Stdev | Difference | Ratio | Score 1 | Score 2 |
|---|---|---|---|---|---|---|---|
| 1 | 20 | 25 | 5 | -5 (value-avg) | -1 (diff/stdev) | -33,3 (ratio/3 *100) | 66,7 (score1 +100) |
| 2 | 30 | 25 | 5 | 5 | 1 | 33,3 | 133,3 |
Now i need this in Qlik Sense.
What I tried is the formula: ((((Sum([Households])-Avg([Households]))/stdev([Households]))/3)*100)+100
But it did not work.
I hope i could make the problem clear.
I appreciate your help. Thank you!
- Mark as New
- Bookmark
- Subscribe
- Mute
- Subscribe to RSS Feed
- Permalink
- Report Inappropriate Content
I am not sure how this works, but because nobody answered my question i will just try to pick this right up to the top. Thank you!
- Mark as New
- Bookmark
- Subscribe
- Mute
- Subscribe to RSS Feed
- Permalink
- Report Inappropriate Content
'it did not work' is not a good issue description. Could you be more specific?
And it would really help if you could post some sample lines of data.
I can only guess that you may want something like
| Area | Sum(Value) | avg(Total Value) | Stdev(TOTAL Value)* sqrt(Count(TOTAL DISTINCT Area)-1)/sqrt(Count(TOTAL DISTINCT Area)) | =Column(1) - column(2) | column(4)/column(3) | column(5)/3*100 | column(6)+100 |
|---|---|---|---|---|---|---|---|
| 50 | 25 | 5 | 25 | 5 | 166,67 | 266,67 | |
| 1 | 20 | 25 | 5 | -5 | -1 | -33,33 | 66,67 |
| 2 | 30 | 25 | 5 | 5 | 1 | 33,33 | 133,33 |
- Mark as New
- Bookmark
- Subscribe
- Mute
- Subscribe to RSS Feed
- Permalink
- Report Inappropriate Content
Hello swuehl,
thank you for the answer.
I actually do not know why it does not work.
If I try the formula that i posted ((((Sum([Households])-Avg([Households]))/stdev([Households]))/3)*100)+100))) the columns are empty.
I copied some lines from the excel-sheet i exported from qlik.
For each of these columns i need the model.
| Postal | Sum(DB1) | Sum(Bonus) | Sum(Taxes) | Sum(Costumers) | Sum(Households) | Sum(Income) |
|---|---|---|---|---|---|---|
| 63928 | 2162566,614 | 310838,1772 | 2078524,35 | 60,78 | 1101 | 44853,00 |
| 64754 | 3056356,155 | 483958,0108 | 2892561,6 | 11,66 | 338 | 40581,00 |
| 68159 | 1019263,95 | 159013,0162 | 1120686 | 472,66 | 12245 | 28861,00 |
| 68161 | 1034790,483 | 160582,6294 | 1134150 | 436,22 | 10337 | 27050,00 |
| 68163 | 1036322,055 | 162123,0445 | 1142232 | 741,85 | 13789 | 39815,00 |
| 68165 | 1036663,807 | 162165,2594 | 1142232 | 770,22 | 13705 | 33689,00 |
| 68167 | 1036487,858 | 162143,8898 | 1142232 | 661,63 | 15175 | 29636,00 |
| 68169 | 1036584,126 | 162159,5031 | 1142232 | 581,67 | 15307 | 33812,00 |
| 68199 | 1036559,996 | 162157,2881 | 1142232 | 806,20 | 15474 | 37699,00 |
| 68219 | 1016058,05 | 159002,9332 | 1117608 | 591,08 | 12263 | 41704,00 |
| 68229 | 1036634,605 | 162163,3767 | 1142232 | 121,80 | 2813 | 38802,00 |
| 68239 | 1036538,232 | 162153,2872 | 1142232 | 488,19 | 7616 | 44973,00 |
| 68259 | 1016144,769 | 159010,2063 | 1117608 | 662,36 | 11744 | 47258,00 |
| 68305 | 1036646,878 | 162164,9188 | 1142232 | 598,66 | 14892 | 43764,00 |
| 68307 | 1036275,559 | 162117,6493 | 1142232 | 476,63 | 12952 | 41185,00 |
| 68309 | 1039115,906 | 162193,3728 | 1145310 | 754,60 | 16298 | 40529,00 |
| 68526 | 1096445,126 | 162245,0048 | 1037600,85 | 340,11 | 5804 | 49631,00 |
| 68535 | 1161548,268 | 191326,7271 | 1107741,7 | 382,54 | 7045 | 45037,00 |
| 68542 | 1987983,326 | 297278,7233 | 1825882,5 | 341,63 | 5810 | 47356,00 |
| 68549 | 1069875,521 | 153714,3833 | 1051773,9 | 234,50 | 3746 | 57277,00 |
| 68723 | 3283286,237 | 481541,3618 | 3101026,5 | 1164,76 | 20949 | 49502,00 |
| 68753 | 1098452,651 | 161628,5895 | 1038909,3 | 516,62 | 9567 | 47150,00 |
| 68766 | 960702,6988 | 149750,4572 | 900430,5 | 555,45 | 10136 | 48140,00 |
| 68775 | 1112355,955 | 154809,7929 | 1094627,4 | 361,90 | 6229 | 49718,00 |
| 68782 | 1090272,798 | 162521,3171 | 1031058,6 | 420,98 | 7347 | 47327,00 |
| 68789 | 1092671,205 | 162161,5951 | 1032367,05 | 350,96 | 6051 | 48852,00 |
| 68794 | 1095015,074 | 162320,4801 | 1034983,95 | 220,49 | 4298 | 47787,00 |
| 68799 | 1098817,209 | 162347,0925 | 1038909,3 | 180,78 | 3354 | 51001,00 |
| 68804 | 1090046,31 | 162516,5769 | 1031058,6 | 141,74 | 2491 | 50058,00 |
| 68809 | 1090467,688 | 162532,4845 | 1031058,6 | 180,02 | 3072 | 48910,00 |
| 69115 | 988960,1067 | 157794,2138 | 1028481 | 771,18 | 12961 | 39656,00 |
| 69117 | 990588,5081 | 159349,5919 | 1036203 | 393,40 | 7101 | 36944,00 |
| 69118 | 969817,8554 | 156222,2978 | 1012731 | 474,79 | 6881 | 48997,00 |
- Mark as New
- Bookmark
- Subscribe
- Mute
- Subscribe to RSS Feed
- Permalink
- Report Inappropriate Content
Have you tried with the expressions I posted above and used in my sample QVW?
I think you need to use the TOTAL qualifier on some aggregations (e.g. when you want to calculate the average across all areas).
If you need to calculate an average of aggregated (i.e. sum'med) values, you need to use advanced aggregation (the aggr() function).
Could you upload some lines of your raw data for Households, maybe only for some areas, and add your requested outcome?
- Mark as New
- Bookmark
- Subscribe
- Mute
- Subscribe to RSS Feed
- Permalink
- Report Inappropriate Content
I do not know how to use the qvw-file, so I am still searching for that.
I will try the total qualifier. Thank you!
Here is a sample: The Households raw data and the steps i did in Excel. I hope this is what you mean or need.
Thank you!
| Postal | Value (Households Sample) | AVG (Sample) | STDEV (Sample) | Difference (Value,AVG) | Ratio (Difference, STDEV) | (Ratio *100) /3 | Score! ((Ratio*100/3) +100) |
|---|---|---|---|---|---|---|---|
| 64754 | 40581,00 | 43208,52 | 7175,86 | -2627,52 | -0,37 | -12,21 | 87,79 |
| 68159 | 28861,00 | 43208,52 | 7175,86 | -14347,52 | -2,00 | -66,65 | 33,35 |
| 68161 | 27050,00 | 43208,52 | 7175,86 | -16158,52 | -2,25 | -75,06 | 24,94 |
| 68163 | 39815,00 | 43208,52 | 7175,86 | -3393,52 | -0,47 | -15,76 | 84,24 |
| 68165 | 33689,00 | 43208,52 | 7175,86 | -9519,52 | -1,33 | -44,22 | 55,78 |
| 68167 | 29636,00 | 43208,52 | 7175,86 | -13572,52 | -1,89 | -63,05 | 36,95 |
| 68169 | 33812,00 | 43208,52 | 7175,86 | -9396,52 | -1,31 | -43,65 | 56,35 |
| 68199 | 37699,00 | 43208,52 | 7175,86 | -5509,52 | -0,77 | -25,59 | 74,41 |
| 68219 | 41704,00 | 43208,52 | 7175,86 | -1504,52 | -0,21 | -6,99 | 93,01 |
| 68229 | 38802,00 | 43208,52 | 7175,86 | -4406,52 | -0,61 | -20,47 | 79,53 |
| 68239 | 44973,00 | 43208,52 | 7175,86 | 1764,48 | 0,25 | 8,20 | 108,20 |
| 68259 | 47258,00 | 43208,52 | 7175,86 | 4049,48 | 0,56 | 18,81 | 118,81 |
| 68305 | 43764,00 | 43208,52 | 7175,86 | 555,48 | 0,08 | 2,58 | 102,58 |
| 68307 | 41185,00 | 43208,52 | 7175,86 | -2023,52 | -0,28 | -9,40 | 90,60 |
| 68309 | 40529,00 | 43208,52 | 7175,86 | -2679,52 | -0,37 | -12,45 | 87,55 |
| 68526 | 49631,00 | 43208,52 | 7175,86 | 6422,48 | 0,90 | 29,83 | 129,83 |
| 68535 | 45037,00 | 43208,52 | 7175,86 | 1828,48 | 0,25 | 8,49 | 108,49 |
| 68542 | 47356,00 | 43208,52 | 7175,86 | 4147,48 | 0,58 | 19,27 | 119,27 |
| 68549 | 57277,00 | 43208,52 | 7175,86 | 14068,48 | 1,96 | 65,35 | 165,35 |
| 68723 | 49502,00 | 43208,52 | 7175,86 | 6293,48 | 0,88 | 29,23 | 129,23 |
| 68753 | 47150,00 | 43208,52 | 7175,86 | 3941,48 | 0,55 | 18,31 | 118,31 |
| 68766 | 48140,00 | 43208,52 | 7175,86 | 4931,48 | 0,69 | 22,91 | 122,91 |
| 68775 | 49718,00 | 43208,52 | 7175,86 | 6509,48 | 0,91 | 30,24 | 130,24 |
| 68782 | 47327,00 | 43208,52 | 7175,86 | 4118,48 | 0,57 | 19,13 | 119,13 |
| 68789 | 48852,00 | 43208,52 | 7175,86 | 5643,48 | 0,79 | 26,22 | 126,22 |
| 68794 | 47787,00 | 43208,52 | 7175,86 | 4578,48 | 0,64 | 21,27 | 121,27 |
| 68799 | 51001,00 | 43208,52 | 7175,86 | 7792,48 | 1,09 | 36,20 | 136,20 |
| 68804 | 50058,00 | 43208,52 | 7175,86 | 6849,48 | 0,95 | 31,82 | 131,82 |
- Mark as New
- Bookmark
- Subscribe
- Mute
- Subscribe to RSS Feed
- Permalink
- Report Inappropriate Content
To do this in script:
T1:
LOAD * Inline
[
Postal, Value
64754, 40581.00
68159, 28861.00
68161, 27050.00
68163, 39815.00
68165, 33689.00
68167, 29636.00
68169, 33812.00
68199, 37699.00
68219, 41704.00
68229, 38802.00
68239, 44973.00
68259, 47258.00
68305, 43764.00
68307, 41185.00
68309, 40529.00
68526, 49631.00
68535, 45037.00
68542, 47356.00
68549, 57277.00
68723, 49502.00
68753, 47150.00
68766, 48140.00
68775, 49718.00
68782, 47327.00
68789, 48852.00
68794, 47787.00
68799, 51001.00
68804, 50058.00
];
Join (T1)
LOAD Avg(Value) As Avg,
Stdev(Value) As Stdev
Resident T1;
T2:
LOAD *,
(Ratio * 100 / 3) + 100 As Score;
LOAD *,
Difference / Stdev As Ratio;
LOAD Postal,
Value,
Avg,
Stdev,
Value - Avg As Difference
Resident T1;
DROP Table T1;
- Mark as New
- Bookmark
- Subscribe
- Mute
- Subscribe to RSS Feed
- Permalink
- Report Inappropriate Content
To do in the front end, create a straight table with Postal as dimension, and then the following expressions:
=Sum(Value)
=Avg(TOTAL Aggr(Sum(Value), Postal))
=Stdev(TOTAL Aggr(Sum(Value), Postal))
=Sum(Value) - Avg(TOTAL Aggr(Sum(Value), Postal))
=(Sum(Value) - Avg(TOTAL Aggr(Sum(Value), Postal))) / Stdev(TOTAL Aggr(Sum(Value), Postal))
=(((Sum(Value) - Avg(TOTAL Aggr(Sum(Value), Postal))) / Stdev(TOTAL Aggr(Sum(Value), Postal))) * 100/3) + 100
- Mark as New
- Bookmark
- Subscribe
- Mute
- Subscribe to RSS Feed
- Permalink
- Report Inappropriate Content
Hello Jonathan,
thank you.
I am really not good with these things, i do not know if you mean like this:
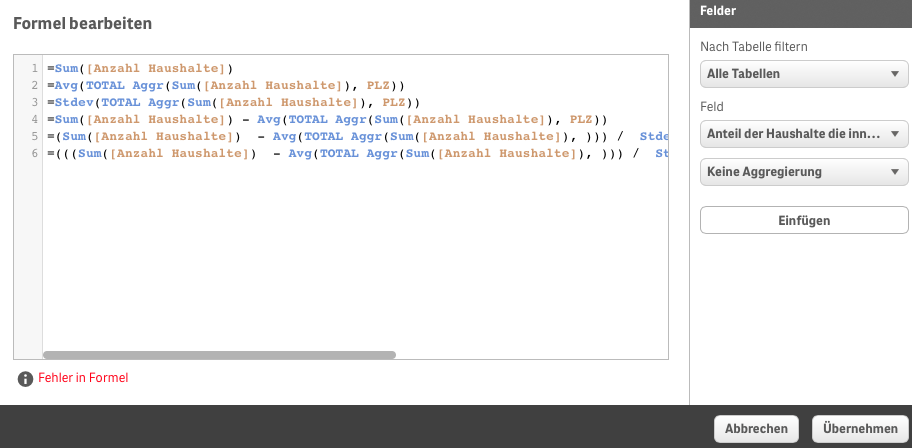
"Anzahl Haushalte" = Households (Value)
"PLZ" = Postal
The notification says: Garbage after expression "="