Unlock a world of possibilities! Login now and discover the exclusive benefits awaiting you.
- Qlik Community
- :
- Forums
- :
- Analytics
- :
- New to Qlik Analytics
- :
- Re: Select chart based on the user input text
- Subscribe to RSS Feed
- Mark Topic as New
- Mark Topic as Read
- Float this Topic for Current User
- Bookmark
- Subscribe
- Mute
- Printer Friendly Page
- Mark as New
- Bookmark
- Subscribe
- Mute
- Subscribe to RSS Feed
- Permalink
- Report Inappropriate Content
Select chart based on the user input text
Hi Experts ,
I have a scenario.
for example , i have the bar chart dimension is service line(Values like: ERS,CCI,DPO ), expre is count (emp), and i have the input box , in that input box i have given the input like ERS, based upon input chart will be display. (in Qlik Sense)
Accepted Solutions
- Mark as New
- Bookmark
- Subscribe
- Mute
- Subscribe to RSS Feed
- Permalink
- Report Inappropriate Content
Hi
Please
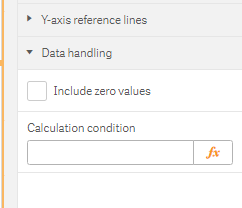
In Addons Uncheck Zero Values
if it is ticked it will give zero values
Thanks
Kashyap.R
- Mark as New
- Bookmark
- Subscribe
- Mute
- Subscribe to RSS Feed
- Permalink
- Report Inappropriate Content
Hi
Try creating a variable with the input box
Give this expression in dimension
If(VariableName= 'ERS', ERS , If( VariableName= 'CCI' , CCI, If( VariableName= 'DPO ' , DPO , ERS)))
Hope this helps
Thanks
Kashyap.R
- Mark as New
- Bookmark
- Subscribe
- Mute
- Subscribe to RSS Feed
- Permalink
- Report Inappropriate Content
NBI Clearance as it states that they have good character and are not a criminal. But, while working in Dubai, it doesn’t seem necessary, as can be used for immigration and other purposes.
- Mark as New
- Bookmark
- Subscribe
- Mute
- Subscribe to RSS Feed
- Permalink
- Report Inappropriate Content
Dear Kashyap,
Thanks for reply,
but if I have 100 records in a [service line] field , that time shall I write 100 if conditions for all ? .
But Based on the input text [service line] field value will be displayed in a chart, this is i'm expecting .
- Mark as New
- Bookmark
- Subscribe
- Mute
- Subscribe to RSS Feed
- Permalink
- Report Inappropriate Content
Hi
Sorry, I understood they are all different dimensions.
Try this in your dimension
if(ISnull(if(ServiceLine='$(Variable)',ServiceLine))=0,ServiceLine,'Total')
Hope this works for you
Thanks
Kashyap.R
- Mark as New
- Bookmark
- Subscribe
- Mute
- Subscribe to RSS Feed
- Permalink
- Report Inappropriate Content
Hi Kashyap,
Thank you so much for your reply
what you are given the logic is working fine, but one small modification is required in that . if I am not enter any value of the [service line] field it will shows the TOTAL value in one Bar, but instead of Total I would like to display the entire [service line] values in the bar chart.
- Mark as New
- Bookmark
- Subscribe
- Mute
- Subscribe to RSS Feed
- Permalink
- Report Inappropriate Content
Hi
Try this it is working but it is a little bit different
Dimension: ServiceLine
Measure: if(len(Variable)=0,Sum(Value),Sum({<ServiceLine={"$(Var)"}>}Value))
Note: 1) Make sure to uncheck null values in dimensions
2) In Addons Uncheck Zero Values
Hope this helps
Thanks
Kashyap.R
- Mark as New
- Bookmark
- Subscribe
- Mute
- Subscribe to RSS Feed
- Permalink
- Report Inappropriate Content
Hi Kashyap,
Thanks for your reply,
what you are providing the expression is working fine but one thing is Chart is display the input value and along with remaining values. But I want to display the only input value on the chart not remaining.
for reference please check below image
Regards,
Pradeep K
- Mark as New
- Bookmark
- Subscribe
- Mute
- Subscribe to RSS Feed
- Permalink
- Report Inappropriate Content
Hi
Please
In Addons Uncheck Zero Values
if it is ticked it will give zero values
Thanks
Kashyap.R