Unlock a world of possibilities! Login now and discover the exclusive benefits awaiting you.
- Qlik Community
- :
- Forums
- :
- Analytics
- :
- New to Qlik Analytics
- :
- Re: Select the 1% of the most expensive population
- Subscribe to RSS Feed
- Mark Topic as New
- Mark Topic as Read
- Float this Topic for Current User
- Bookmark
- Subscribe
- Mute
- Printer Friendly Page
- Mark as New
- Bookmark
- Subscribe
- Mute
- Subscribe to RSS Feed
- Permalink
- Report Inappropriate Content
Select the 1% of the most expensive population
Hi,
If someone gives me a light I will be very grateful
- Mark as New
- Bookmark
- Subscribe
- Mute
- Subscribe to RSS Feed
- Permalink
- Report Inappropriate Content
Can u please share what u have?
some data?
It would be much easier to imagine a solution when we know how the data is constructed/calculated 
Thanks
- Mark as New
- Bookmark
- Subscribe
- Mute
- Subscribe to RSS Feed
- Permalink
- Report Inappropriate Content
Hi Omar,
My data is structurate for servises then i have to aggregate the data for paciente, like that aggr(Sum(Costo),Paciente)
- Mark as New
- Bookmark
- Subscribe
- Mute
- Subscribe to RSS Feed
- Permalink
- Report Inappropriate Content
Can u dos thing like :
here's what I have:
| Country | Measure |
|---|---|
and here's what I want to do : ...
?
- Mark as New
- Bookmark
- Subscribe
- Mute
- Subscribe to RSS Feed
- Permalink
- Report Inappropriate Content
Have you tried looking at this? It seems like it would set you off in the right direction. And don't forget to give us some example data to help you with. Omar is really, really good and helpful if you give him something to work with.
- Mark as New
- Bookmark
- Subscribe
- Mute
- Subscribe to RSS Feed
- Permalink
- Report Inappropriate Content
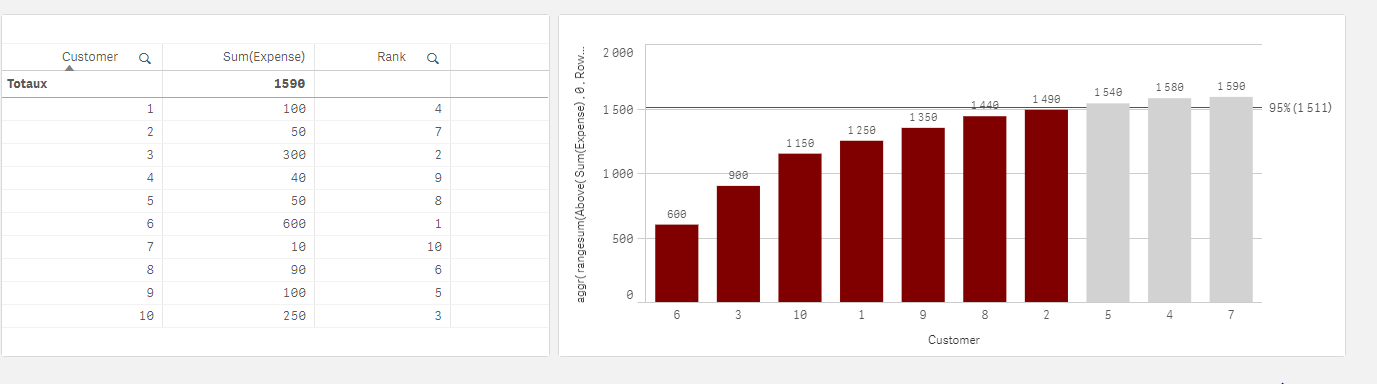
STill don't know what u want to do; but I'll be trying to imagine that u have this and u want a pareto :
1) I'll add a rank field in my script
t:
load * Inline [
Customer, Expense
1,100
2,50
3,300
4,40
5,50
6,600
7,10
8,90
9,100
10,250
];
t0:
load Customer, sum(Expense) as sum Resident t Group by Customer ;
NoConcatenate
load * ,RowNo() as Rank;
load Customer Resident t0 Order by sum desc;
Drop table t0;
2)
Create a bar chart
as dimension : Customer
as measure:
aggr(
rangesum(Above(
Sum({<Customer>}Expense)
, 0 , RowNo()))
,Rank)
sort it with expression : Rank (Ascend)
color it by expression:
if(aggr(
rangesum(Above(
Sum({<Customer>}Expense)
, 0 , RowNo()))
,Rank) / sum(total {<Customer>} Expense) <=0.95,red())
Result:
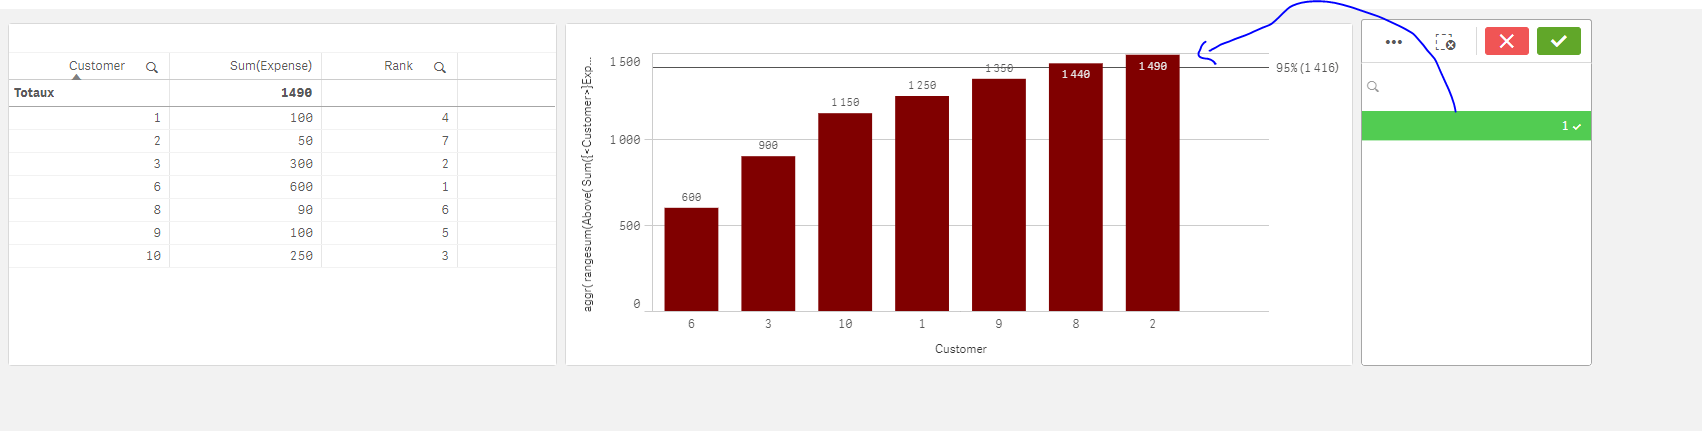
Now as a filter, create it as follow:
=aggr(if(aggr(
rangesum(Above(
Sum({<Customer>}Expense)
, 0 , RowNo()))
,Rank) / sum(total{<Customer>} Expense) <=0.95,'1'),Customer)
Result:
- Mark as New
- Bookmark
- Subscribe
- Mute
- Subscribe to RSS Feed
- Permalink
- Report Inappropriate Content
Thanks Justin
- Mark as New
- Bookmark
- Subscribe
- Mute
- Subscribe to RSS Feed
- Permalink
- Report Inappropriate Content
Hi,
I have built the pareto with internal variables in the table, and I want to be able to select the highest percentile or a variable that identifies me as 'Pareto Paciente' so that it can be identified as percentiles and be able to filter the 1% of the most expensive patients
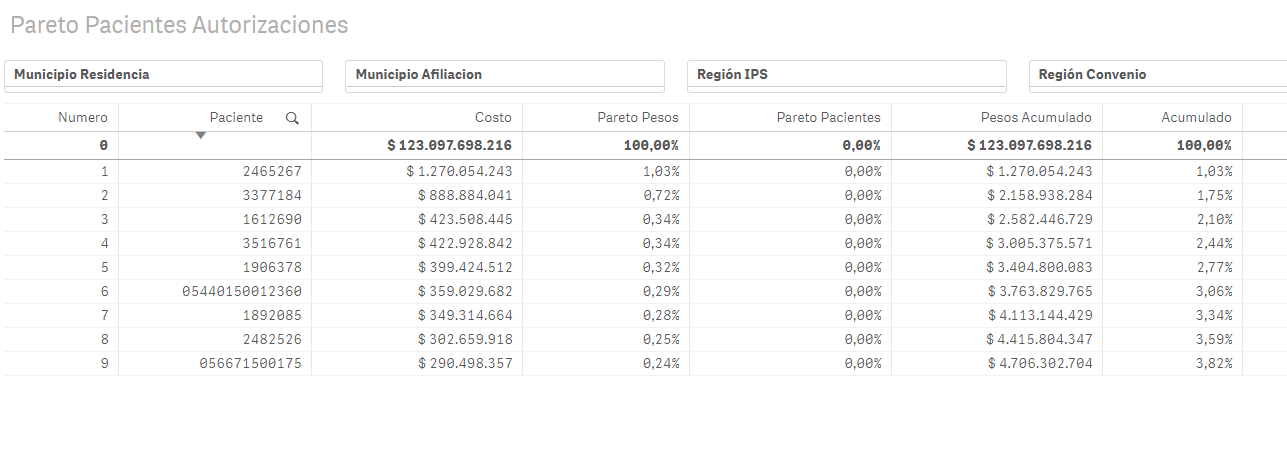
The functions of each variable is:
Numero: this variable ranks patients
RowNO()
Paciente: This variable identify
[CONTRATO_AFIL]
Costo: This variable sum the cost
Sum([Autorizaciones.COSTO_SERVICIO])
Pareto Pesos: this variable is the weight of the cost
sum([Autorizaciones.COSTO_SERVICIO])/sum(total([Autorizaciones.COSTO_SERVICIO]))
Pareto Paciente: this variable is the weight of the pacient
RowNo()/Count(total(Aggr(RowNo(), [CONTRATO_AFIL])))
Pesos Acumulado: this variable is the weight of the accumulated pacient, this variable tells me how far the percentage of the patient is
Costo+IF(isnull(above(Costo)),0,above([Pesos Acumulado]))
Acumulado: this variable is the weight of the accumulated cost
[Pareto Pesos]+IF(isnull(above([Pareto Pesos])),0,above(Acumulado))