Unlock a world of possibilities! Login now and discover the exclusive benefits awaiting you.
- Qlik Community
- :
- Forums
- :
- Analytics
- :
- New to Qlik Analytics
- :
- Re: Set Analysis with simple operator
- Subscribe to RSS Feed
- Mark Topic as New
- Mark Topic as Read
- Float this Topic for Current User
- Bookmark
- Subscribe
- Mute
- Printer Friendly Page
- Mark as New
- Bookmark
- Subscribe
- Mute
- Subscribe to RSS Feed
- Permalink
- Report Inappropriate Content
Set Analysis with simple operator
Hello smart people from this community,
I come here searching for help and doing a simple question that I haven't been able to solve by research,
I have been trying to create an expression in which I want to sum the values from the PERIOD displaying and some other PERIODS above but without using the "above" formula, this is because I don't want the chart values to be affected by PERIOD Filters.My data is something like this:
| PERIOD | VALUE |
|---|---|
| 201709 | 100 |
| 201710 | 200 |
| 201711 | 125 |
| 201712 | 300 |
| 201801 | 326 |
| 201802 | 225 |
| 201803 | 185 |
So in my expression I want
for 201803 to sum The values from 201803,(201803)-1,(201803)-2
for 201802 to sum The values from 201802,(201802)-1,(201802)-2
etc...
So I have something like this:
Sum(VALUE])
+
Sum({<PERIOD={$(=(PERIODO-1))}>} [VALUE])+
Sum({<PERIOD={$(=(PERIODO-2))}>} [VALUE])
I know there is something wrong with the sintaxis but I don't really know how is the correct way.
Thanks a lot for helping me with this.
(PS. I know the formula isn't gonna work when it gets between 2017 and 2018 but I have this already covered with an "if" and a "mid" formula)
Honestly,
Diego Vélez,
Qlik Sense Student.
Accepted Solutions
- Mark as New
- Bookmark
- Subscribe
- Mute
- Subscribe to RSS Feed
- Permalink
- Report Inappropriate Content
IMO, one of the best solutions for requirements like this is using an AsOf Table for your time dimension, a link table that links a period to a set of other periods:
Other options, including a version with above() that also works with selections in your dimension field, are discussed in
Calculating rolling n-period totals, averages or other aggregations
- Mark as New
- Bookmark
- Subscribe
- Mute
- Subscribe to RSS Feed
- Permalink
- Report Inappropriate Content
Because the sum value is fixed for each period, you should implement this logic in the back end (reload script) rather than a chart expression. In reload script you can use Peek() function to access 1 and 2 periods before the current period. Sample script is as follows:
Data:
LOAD * INLINE [
    PERIOD, VALUE
    201709, 100
    201710, 200
    201711, 125
    201712, 300
    201801, 326
    201802, 225
    201803, 185
];

Temp_Data:
LOAD
PERIOD,
Sum(VALUE) as SUMVALUE
Resident Data
Group By PERIOD
Order By PERIOD;

Left Join (Data)
LOAD
PERIOD,
If(RowNo() > 2, SUMVALUE + Peek('SUMVALUE',RowNo()-2,'Temp_Data') + Peek('SUMVALUE',RowNo()-3,'Temp_Data')) as SUMVALUE
Resident Temp_Data;

DROP TABLE Temp_Data;
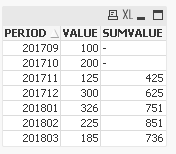
After reload your data table should look like this. You're free to select on field PERIOD without affecting SUMVALUE.
- Mark as New
- Bookmark
- Subscribe
- Mute
- Subscribe to RSS Feed
- Permalink
- Report Inappropriate Content
IMO, one of the best solutions for requirements like this is using an AsOf Table for your time dimension, a link table that links a period to a set of other periods:
Other options, including a version with above() that also works with selections in your dimension field, are discussed in
Calculating rolling n-period totals, averages or other aggregations
- Mark as New
- Bookmark
- Subscribe
- Mute
- Subscribe to RSS Feed
- Permalink
- Report Inappropriate Content
Hi Stefan, thanks a lot for your answer, I'm trying to use The As-Of Table method, for this I read that I need to create a Master Calendar first, so i did a little research about it but it isn't working like expected, could you (or anyone reading this) help me to find what am I doing wrong, I used the next script:
(in Ventas table I created a new File with the next script)
(date#('01/'&mid(PERIOD,5,2)&'/'&mid(PERIOD,1,4),'dd/mm/yyyy')) as Date
So I could get my PERIOD in Date format.
Then i proceeded to make my master calendar:
"Master Calendar":
LOAD
FECHA AS Date,
Year(FECHA) AS Year,
Date(MonthStart(FECHA),'YYYY MMM') as Month,
Weekday(FECHA) AS WeekDay,
inyeartodate(FECHA, maxdate, 0) * -1 AS CurYTDFlag,
inyeartodate(FECHA, maxdate, -1) * -1 AS LastYTDFlag
;
//=== Generate a temp table of dates ===
LOAD
date(mindate + IterNo()) AS FECHA,
maxdate // Used in InYearToDate() above, but not kept
WHILE mindate + IterNo() <= maxdate
;
//=== Get min/max dates from ventas table ===/
LOAD
min(FECHA)-1 as mindate,
max(FECHA) as maxdate
RESIDENT Ventas
;
// ======== Create a list of distinct Months ========
tmpAsOfCalendar:
Load distinct Month
Resident [Master Calendar] ;
// ======== Cartesian product with itself ========
Join (tmpAsOfCalendar)
Load Month as AsOfMonth
Resident tmpAsOfCalendar ;
// ======== Reload, filter and calculate additional fields ========
[As-Of Calendar]:
Load Month,
AsOfMonth,
Round((AsOfMonth-Month)*12/365.2425) as MonthDiff,
Year(AsOfMonth)-Year(Month) as YearDiff
Resident tmpAsOfCalendar
Where AsOfMonth >= Month;
Drop Table tmpAsOfCalendar;
What I'm getting is the next data:
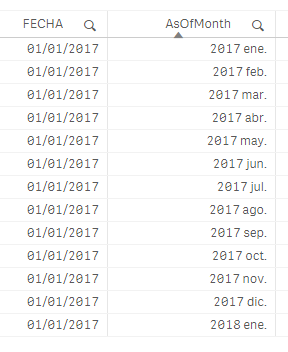
And it's the same for every month.
Thanks a lot again.
- Mark as New
- Bookmark
- Subscribe
- Mute
- Subscribe to RSS Feed
- Permalink
- Report Inappropriate Content
It doesn't look wrong per se.
Your AsOfMonths should link to each Month that precedes the AsOfMonth.
You need to use the AsOfMonth as dimension in your chart, then your expression should automatically use a full accumulation with regard to your periods.
What do you see?
One note: You should use MM as format code for Month, since mm denotes minutes.
(date#('01/'&mid(PERIOD,5,2)&'/'&mid(PERIOD,1,4),'DD/MM/YYYY')) as Date
- Mark as New
- Bookmark
- Subscribe
- Mute
- Subscribe to RSS Feed
- Permalink
- Report Inappropriate Content
Hi vunguyenq89 thanks a lot for your answer, I used the Stefan solution and it worked fine for me, I didn't tried yours because my data isn't as simple as how I showed in the example, it has 1 million registers per Date and there are gonna be loading a lot of years in the app, anyway thanks a lot for the help, I will try to understand how it works for using it in other applications.
- Mark as New
- Bookmark
- Subscribe
- Mute
- Subscribe to RSS Feed
- Permalink
- Report Inappropriate Content
You were right, I corrected the "mm" format to "MM" and now it works fine,
For the rolling year I used the next formula in the chart:
Sum({$<MonthDiff={"<12"}>} Value)
and it worked,
Also for my filters I changed it from Period to AsOfMonth so it works perfect even if I apply date filters.
Thanks again.