Unlock a world of possibilities! Login now and discover the exclusive benefits awaiting you.
- Qlik Community
- :
- Forums
- :
- Analytics
- :
- New to Qlik Analytics
- :
- Re: Set analysis for subtracting multiple date ran...
- Subscribe to RSS Feed
- Mark Topic as New
- Mark Topic as Read
- Float this Topic for Current User
- Bookmark
- Subscribe
- Mute
- Printer Friendly Page
- Mark as New
- Bookmark
- Subscribe
- Mute
- Subscribe to RSS Feed
- Permalink
- Report Inappropriate Content
Set analysis for subtracting multiple date ranges.
Hi there,
There is a date range problem for me. I have selected multiple dates in the filter panel showing a table below:
| Date | sum(Cost) | above(Date) |
| 02/01/2018 | 5,745.0 | - |
| 31/01/2018 | 3,829.0 | 02/01/2018 |
| 23/02/2018 | 1,875.0 | 31/01/2018 |
| 16/03/2018 | 2,392.0 | 23/02/2018 |
| 28/04/2018 | 2,870.0 | 16/03/2018 |
| 10/05/2018 | 7,734.4 | 28/04/2018 |
| 16/05/2018 | 657.6 | 10/05/2018 |
| 01/06/2018 | 531.7 | 16/05/2018 |
| 05/07/2018 | 8,245.2 | 01/06/2018 |
| 12/07/2018 | 603.3 | 05/07/2018 |
Im tending to create a measure to subtract Gap form the selected Date and the previous selected date (ex: Cost in 12/07 - Cost 05/07,...) and the result is for the greater date as:
| Date | Cost | above(Date) | Gap |
| 02/01/2018 | 5,745.0 | - | -1,916.0 |
| 31/01/2018 | 3,829.0 | 02/01/2018 | -1,954.0 |
| 23/02/2018 | 1,875.0 | 31/01/2018 | 517.0 |
| 16/03/2018 | 2,392.0 | 23/02/2018 | 478.0 |
| 28/04/2018 | 2,870.0 | 16/03/2018 | 4,864.4 |
| 10/05/2018 | 7,734.4 | 28/04/2018 | -7,076.8 |
| 16/05/2018 | 657.6 | 10/05/2018 | -125.9 |
| 01/06/2018 | 531.7 | 16/05/2018 | 7,713.5 |
| 05/07/2018 | 8,245.2 | 01/06/2018 | -7,641.9 |
| 12/07/2018 | 603.3 | 05/07/2018 | -603.3 |
my set analysis is
sum({<Date=p(Date),>} Cost)
-
sum({<Date={"$=(above(Date))"}>} Cost)
but it didnot work.
Could anyone enlighten me!
Thanks in advanced.
- « Previous Replies
-
- 1
- 2
- Next Replies »
- Mark as New
- Bookmark
- Subscribe
- Mute
- Subscribe to RSS Feed
- Permalink
- Report Inappropriate Content
It's quite difficult to imagine what you are going to do.
If could, please provide a sample qvf with some samples of related fields.
For the dimension you want to add, if you have no idea how to make it on chart, I suggest to pre-specify it on data-load, then everything will become easier.
As you mentioned, you fixed a specific date to determine value of new dimension, I suggest to put the reference value to a fixed variable (by add equal character '=' before expression in variable).
- Mark as New
- Bookmark
- Subscribe
- Mute
- Subscribe to RSS Feed
- Permalink
- Report Inappropriate Content
Im so sorry for not preparing example carefully. Let me explain again:
The Table of Customer:
| Date | CustID | Cost |
| 23/02 | A | 100 |
| 23/02 | A | 200 |
| 23/02 | B | 500 |
| 16/03 | C | 10 |
| 16/03 | A | 50 |
| 16/03 | B | 1000 |
| 28/04 | A | 500 |
| 28/04 | B | 200 |
| 28/04 | C | 100 |
For the status, im using the measure:
=if(aggr(sum({<Date={'28/04/2018'},>} Cost) -
sum({<Date={'16/03/2018'}>} Cost),CustID)<0,'Less',More).
For Gap(1) is:
sum({<backup_date={'28/04/2018'}>} Cost)
-
sum({<backup_date={'16/03/2018'},>} Cost)
Which can only show only 2 dates while i want some selected date to show the expected table above to check whether customer buy more or less following by the date:
| Date | CustID | Sum Cost | Gap(1) | Status |
| 23/02 | A | 300 | ||
| 16/03 | A | 50 | -250 | Less |
| 28/04 | A | 500 | 450 | More |
| 23/02 | B | 500 | ||
| 16/03 | B | 1000 | 500 | More |
| 28/04 | B | 200 | -800 | Less |
| 16/03 | C | 10 | ||
| 28/04 | C | 100 | 90 | More |
Then, I just want to minisize the table below only by date showing the amount for the final result :
| Date | Gap | Status |
| 23/02 | 810 | |
| 16/03 | -250 | Less |
| 16/03 | 500 | More |
| 28/04 | -800 | Less |
| 28/04 | 540 | More |
Using Below or Above like you can only show:
| Date | Sum Cost | Gap |
| 23/02 | 810 | |
| 16/03 | 1060 | 250 |
| 28/04 | 800 | -260 |
The question is how i can create a measure that subtract from a punch of selected days.
Thank you a lot!
- Mark as New
- Bookmark
- Subscribe
- Mute
- Subscribe to RSS Feed
- Permalink
- Report Inappropriate Content
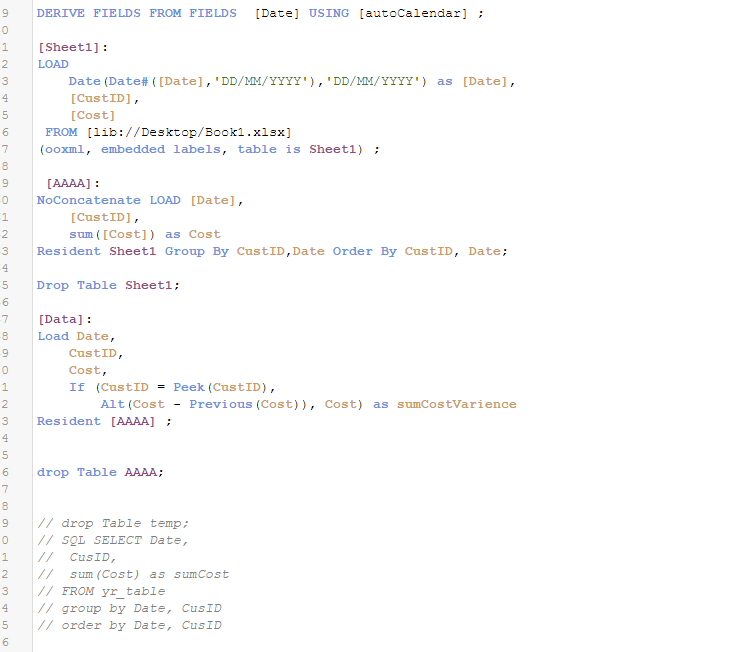
The idea is adding new column in data load to store the cost variance of each account comparing the previous day.
Hope it help.

- Mark as New
- Bookmark
- Subscribe
- Mute
- Subscribe to RSS Feed
- Permalink
- Report Inappropriate Content
You are once of a kind. However, i have to ask my manager to access into the data loader so i prefer something like function measure as set analysis for this situation.
Thank you again.
- Mark as New
- Bookmark
- Subscribe
- Mute
- Subscribe to RSS Feed
- Permalink
- Report Inappropriate Content
if(RangeSum(aggr(sum(Cost)-above(Sum(Cost),1),CustID))<0,'Less','More')
Try this, but it will not give you an expected results bcz Each Customer ID has different Status.
- « Previous Replies
-
- 1
- 2
- Next Replies »