Unlock a world of possibilities! Login now and discover the exclusive benefits awaiting you.
- Qlik Community
- :
- Forums
- :
- Analytics
- :
- New to Qlik Analytics
- :
- Re: Setting Gauge Chart Min Based on Previous Year
- Subscribe to RSS Feed
- Mark Topic as New
- Mark Topic as Read
- Float this Topic for Current User
- Bookmark
- Subscribe
- Mute
- Printer Friendly Page
- Mark as New
- Bookmark
- Subscribe
- Mute
- Subscribe to RSS Feed
- Permalink
- Report Inappropriate Content
Setting Gauge Chart Min Based on Previous Year
Hi All
I'm Stuck and need some help.
I created a Gauge KPI that sums our LG value. The Gauge is linked to a year month Filter and it works perfectly showing me the current selection's SUM(LG).
Problem: I would like to add a Min and Max Limit to the Gauge which is equal to
Min - SUM(LG) of the current selection - 1 Year
Max - SUM(LG) of the current selection - 1 Year + 30%
I did try before(sum(LG),-1) but it did not work.
In other word:
Blue = Last Year
Point = Current Year
Yellow = Last Year + 30%

- Mark as New
- Bookmark
- Subscribe
- Mute
- Subscribe to RSS Feed
- Permalink
- Report Inappropriate Content
- Mark as New
- Bookmark
- Subscribe
- Mute
- Subscribe to RSS Feed
- Permalink
- Report Inappropriate Content
Thank You for the reply but it still don't work.
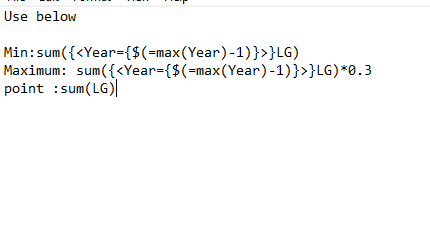
Here is my Formula's:
Point : sum(if(TTYPE = 'Lo', CAPITAL))/1000000
Min: 0
Max : (sum({<Year={$(=max(Year)-1)},TTYPE={"Lo"}>}CAPITAL)*1.3)/1000000
Limit: sum({<Year={$(=max(Year)-1)},TTYPE={"Lo"}>}CAPITAL)/1000000
Results: The Limit and Point still gives the same value
