Unlock a world of possibilities! Login now and discover the exclusive benefits awaiting you.
- Qlik Community
- :
- Forums
- :
- Analytics
- :
- New to Qlik Analytics
- :
- Re: Show 3 Fiscal Years Trend
- Subscribe to RSS Feed
- Mark Topic as New
- Mark Topic as Read
- Float this Topic for Current User
- Bookmark
- Subscribe
- Mute
- Printer Friendly Page
- Mark as New
- Bookmark
- Subscribe
- Mute
- Subscribe to RSS Feed
- Permalink
- Report Inappropriate Content
Show 3 Fiscal Years Trend
Hi experts!
I want to show a 3 Fiscal Year(FY) trend on multiple line chart.
I have a data columns in my excel telling me the fiscal year the transactions is, but I am not sure how to show 3 FY trend.
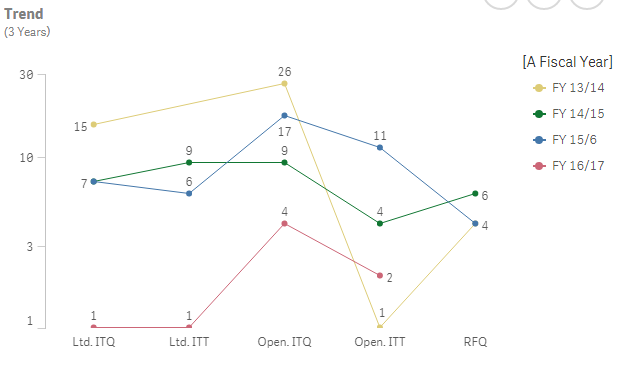
Here, it is showing me 4 FY trend, which is what I have in my excel data. Now I only want to show 3 FY ( Current FY and pas 2 FY)
How do I script it to show only 3 FY?
Regards,
Frederic
Accepted Solutions
- Mark as New
- Bookmark
- Subscribe
- Mute
- Subscribe to RSS Feed
- Permalink
- Report Inappropriate Content
Add something like below in set analysis that says
fyear = {">$(=Max(fYear)-3)"}
If a post helps to resolve your issue, please accept it as a Solution.
- Mark as New
- Bookmark
- Subscribe
- Mute
- Subscribe to RSS Feed
- Permalink
- Report Inappropriate Content
Add something like below in set analysis that says
fyear = {">$(=Max(fYear)-3)"}
If a post helps to resolve your issue, please accept it as a Solution.
- Mark as New
- Bookmark
- Subscribe
- Mute
- Subscribe to RSS Feed
- Permalink
- Report Inappropriate Content
jiasheng if your query is resolved please close the thread or provide more detail!
Qlik Community Tip: Marking Replies as Correct or Helpful
If a post helps to resolve your issue, please accept it as a Solution.
- Mark as New
- Bookmark
- Subscribe
- Mute
- Subscribe to RSS Feed
- Permalink
- Report Inappropriate Content
Hi, where do I add this in as I already have a measure?
- Mark as New
- Bookmark
- Subscribe
- Mute
- Subscribe to RSS Feed
- Permalink
- Report Inappropriate Content
You need to use this on a numeric Year field
the above set translates to; example
fyear = {">$(=Max(fYear)-3)"}
fYear = > (2017 - 3); ie fYear > 2014 .......so in your chart you will see data for year 2015,2016,2017
fyear should be a numeric year field with values like 2014,2015,2015 etc..
If a post helps to resolve your issue, please accept it as a Solution.