Unlock a world of possibilities! Login now and discover the exclusive benefits awaiting you.
- Qlik Community
- :
- Forums
- :
- Analytics
- :
- New to Qlik Analytics
- :
- Show KPI based on Color
- Subscribe to RSS Feed
- Mark Topic as New
- Mark Topic as Read
- Float this Topic for Current User
- Bookmark
- Subscribe
- Mute
- Printer Friendly Page
- Mark as New
- Bookmark
- Subscribe
- Mute
- Subscribe to RSS Feed
- Permalink
- Report Inappropriate Content
Show KPI based on Color
I am taking recent 2 days Data that are highlighted in yellow. If the previous date %value is lesser than current date % value, then the colour should be green, else red.
I have calculated the difference % for both date. Ie (9/13/2017 and 9/13/2017). But I have to show difference % in color representing the increase or decrease in KPI Qlik sense.
Scenario : 1 Scenario : 2
Date | Value | Date | Value |
9/11/2017 | 10000 | 9/11/2017 | 10000 |
9/11/2017 | 10000 | 9/11/2017 | 10000 |
9/12/2017 | 15000 | 9/12/2017 | 15000 |
9/12/2017 | 15000 | 9/12/2017 | 15000 |
9/13/2017 | 30000 | 9/13/2017 | 25000 |
9/13/2017 | 30000 | 9/13/2017 | 25000 |
9/14/2017 | 35000 | 9/14/2017 | 35000 |
9/14/2017 | 35000 | 9/14/2017 | 35000 |
|
|
|
|
Difference | -5000 | Difference | 10000 |
diff % | 17% | diff % | 40% |
But the colour is not changing accordingly. Can anyone help how to show the diff % based on colour
- Mark as New
- Bookmark
- Subscribe
- Mute
- Subscribe to RSS Feed
- Permalink
- Report Inappropriate Content
I am not clear from your screenshot what you have done.
You should be able to click on the left side of the color and pick a color and then pick a value. Then do the same for the right side with a different color.
- Mark as New
- Bookmark
- Subscribe
- Mute
- Subscribe to RSS Feed
- Permalink
- Report Inappropriate Content
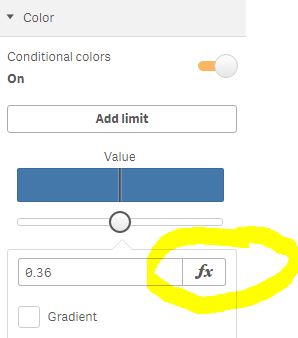
If you want to assign colors for less than and greater than particular value then
add that value (or any expression) in fx you have highlighted and then you will see a black vertical line separating that bar in blue.
Now click on left part of bar and it will give you pallete of color. choose appropriate color and repeat same for right part of bar.
In this way if you will get 2 color when value is less or greater than specified value.