Unlock a world of possibilities! Login now and discover the exclusive benefits awaiting you.
- Qlik Community
- :
- Forums
- :
- Analytics
- :
- New to Qlik Analytics
- :
- Show and hide the graphs in a chart by clicks on a...
Options
- Subscribe to RSS Feed
- Mark Topic as New
- Mark Topic as Read
- Float this Topic for Current User
- Bookmark
- Subscribe
- Mute
- Printer Friendly Page
Turn on suggestions
Auto-suggest helps you quickly narrow down your search results by suggesting possible matches as you type.
Showing results for
Anonymous
Not applicable
2016-01-22
02:58 PM
- Mark as New
- Bookmark
- Subscribe
- Mute
- Subscribe to RSS Feed
- Permalink
- Report Inappropriate Content
Show and hide the graphs in a chart by clicks on a button
Hi,
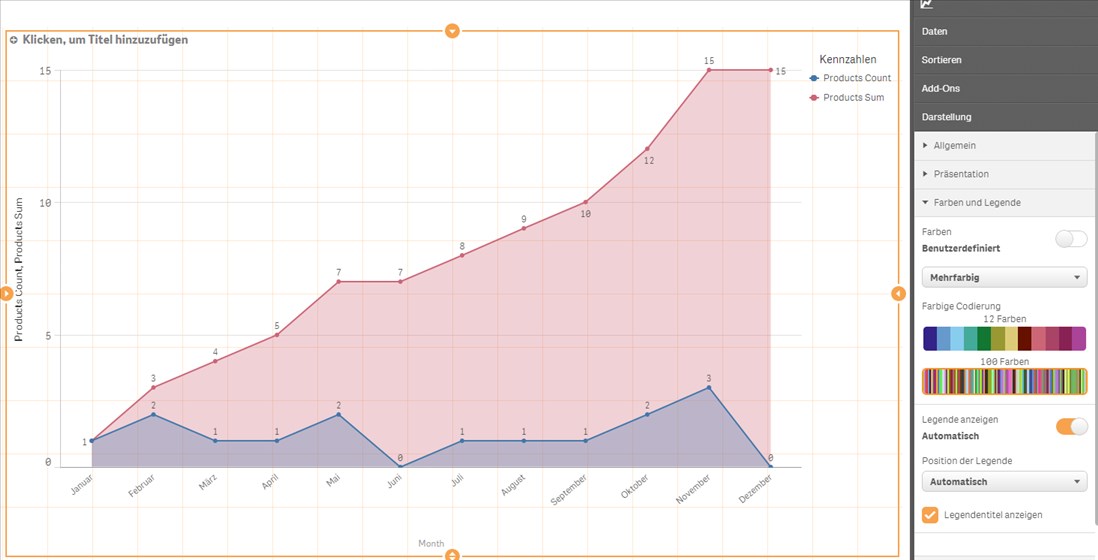
I need a function, where can i show and hide the graphs in a chart by clicks on a button.
For example i make a field with two buttons.
1. "Button Count"
2. "Button Sum"
If i activate the button "Button Count" the blue line should showing in the chart.
If i activate the button "Button Sum" the red line should showing in the chart, too.
If i deactivate the button "Button Count" the blue line don´t should showing in the chart, but the red line (because "Button Sum" is always activated.
etc.
How can i do this?
Regards,
Fritz
171 Views
0 Replies
Community Browser
