Unlock a world of possibilities! Login now and discover the exclusive benefits awaiting you.
- Qlik Community
- :
- Forums
- :
- Analytics
- :
- New to Qlik Analytics
- :
- Show on a Line Chart based on the dimension you se...
- Subscribe to RSS Feed
- Mark Topic as New
- Mark Topic as Read
- Float this Topic for Current User
- Bookmark
- Subscribe
- Mute
- Printer Friendly Page
- Mark as New
- Bookmark
- Subscribe
- Mute
- Subscribe to RSS Feed
- Permalink
- Report Inappropriate Content
Show on a Line Chart based on the dimension you selected in a table
Hello, good day!
I'll tell you about the problem that I'm not able to solve: I have a table formed by an island dimension (that comes from a LOAD * Inline).
| 2018, Q1 | |
| Germany | 3.213.295 |
| Brazil | 484.193 |
| France | 84.905 |
| Italy | 923.103 |
| Spain | 128.497 |
| Colombia | 84.015 |
| TOTAL | 4.918.008 |
The client asks me if, for example, I select "Germany" to show me the evolution for each quarter of the selected thing. The problem is that in my graphic when I select "Germany" it only shows me the value of that month. On the other hand, if I do not select anything, it does not show me anything.
I was using alternative measures and it gave me good results. But now the client asks me to be interactive, to select what I want to see from the table and not from the graph.
By the doubts, I leave you the expression of the measures:
| MEASURE OF TABLE |
|---|
If ( DIM_COUNTRY = 'Germany', sum({ $<DIM_AGRUP = {'321', '743'}, DIM_YEAR={$(=only(DIM_YEAR))}, FLAG_ACUM_QUARTER = {'Acum'}> } DIM_SALES) , If (DIM_COUNTRY = 'Brazil', sum({ $<DIM_AGRUP = {'453','289'}, DIM_YEAR={$(=only(DIM_YEAR))}, FLAG_ACUM_QUARTER = {'Acum'}> } DIM_SALES) , If (DIM_COUNTRY = 'France', sum({ $<DIM_AGRUP = {'902', '841'}, DIM_YEAR={$(=only(DIM_YEAR))}, FLAG_ACUM_QUARTER = {'Acum'}> } DIM_SALES) , If (DIM_COUNTRY = 'Italy', sum({ $<DIM_AGRUP = {'519', '732'}, DIM_YEAR={$(=only(DIM_YEAR))}, FLAG_ACUM_QUARTER = {'Acum'}> } DIM_SALES) , If (DIM_COUNTRY = 'Spain', sum({ $<DIM_AGRUP = {'622', '890'}, DIM_YEAR={$(=only(DIM_YEAR))}, FLAG_ACUM_QUARTER = {'Acum'}> } DIM_SALES) , If (DIM_COUNTRY = 'Colombia', sum({ $<DIM_AGRUP = {'601', '394'}, DIM_YEAR={$(=only(DIM_YEAR))}, FLAG_ACUM_QUARTER = {'Acum'}> } DIM_SALES) , If (DIM_COUNTRY = 'TOTAL', sum({ $<DIM_AGRUP = {'321', '743', '453','289', '902', '841', '519', '732', '622', '890', '601', '394'}, DIM_YEAR={$(=only(DIM_YEAR))}, FLAG_ACUM_QUARTER = {'Acum'}> } DIM_SALES) ))))))) |
| MEASURE OF LINE CHART |
|---|
If ( DIM_COUNTRY = 'Germany', sum({ $<DIM_AGRUP = {'321', '743'}, DIM_YEAR, DIM_QUARTER, FLAG_ACUM_QUARTER> } DIM_SALES) , If (DIM_COUNTRY = 'Brazil', sum({ $<DIM_AGRUP = {'453','289'}, DIM_YEAR, DIM_QUARTER, FLAG_ACUM_QUARTER> } DIM_SALES) , If (DIM_COUNTRY = 'France', sum({ $<DIM_AGRUP = {'902', '841'}, DIM_YEAR, DIM_QUARTER, FLAG_ACUM_QUARTER> } DIM_SALES) , If (DIM_COUNTRY = 'Italy', sum({ $<DIM_AGRUP = {'519', '732'}, DIM_YEAR, DIM_QUARTER, FLAG_ACUM_QUARTER> } DIM_SALES) , If (DIM_COUNTRY = 'Spain', sum({ $<DIM_AGRUP = {'622', '890'}, DIM_YEAR, DIM_QUARTER, FLAG_ACUM_QUARTER> } DIM_SALES) , If (DIM_COUNTRY = 'Colombia', sum({ $<DIM_AGRUP = {'601', '394'}, DIM_YEAR, DIM_QUARTER, FLAG_ACUM_QUARTER> } DIM_SALES) , If (DIM_COUNTRY = 'TOTAL', sum({ $<DIM_AGRUP = {'321', '743', '453','289', '902', '841', '519', '732', '622', '890', '601', '394'}, DIM_YEAR, DIM_QUARTER, FLAG_ACUM_QUARTER> } DIM_SALES) ))))))) |
I appreciate the help you can give me.
Regards,
Martin.
- Mark as New
- Bookmark
- Subscribe
- Mute
- Subscribe to RSS Feed
- Permalink
- Report Inappropriate Content
the "island" may be the issue.
you only have 2 fields in the island, so perhaps you should consider doing a mapping.
... just a suggestion.
best wishes.
- Mark as New
- Bookmark
- Subscribe
- Mute
- Subscribe to RSS Feed
- Permalink
- Report Inappropriate Content
I can not do mapping. The example is perhaps not the best, since issues of job security can not raise the model.
I need to use if the dimension that is already a requirement of the client that reports are seen that way. Each "island" record is made up of data in one or more dimensions, which can be repeated. I do not know if I can be clear about the problem.
- Mark as New
- Bookmark
- Subscribe
- Mute
- Subscribe to RSS Feed
- Permalink
- Report Inappropriate Content
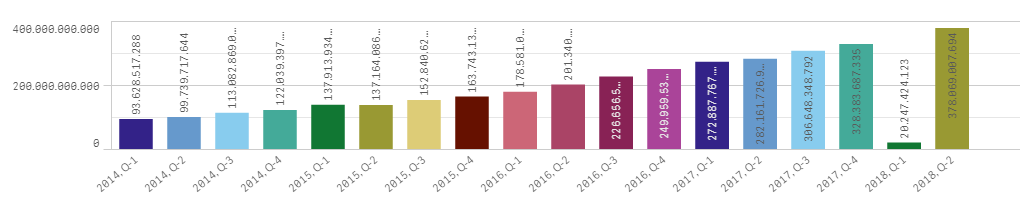
Here's how it should look:
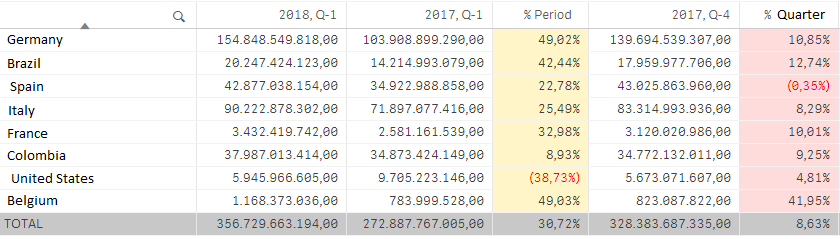
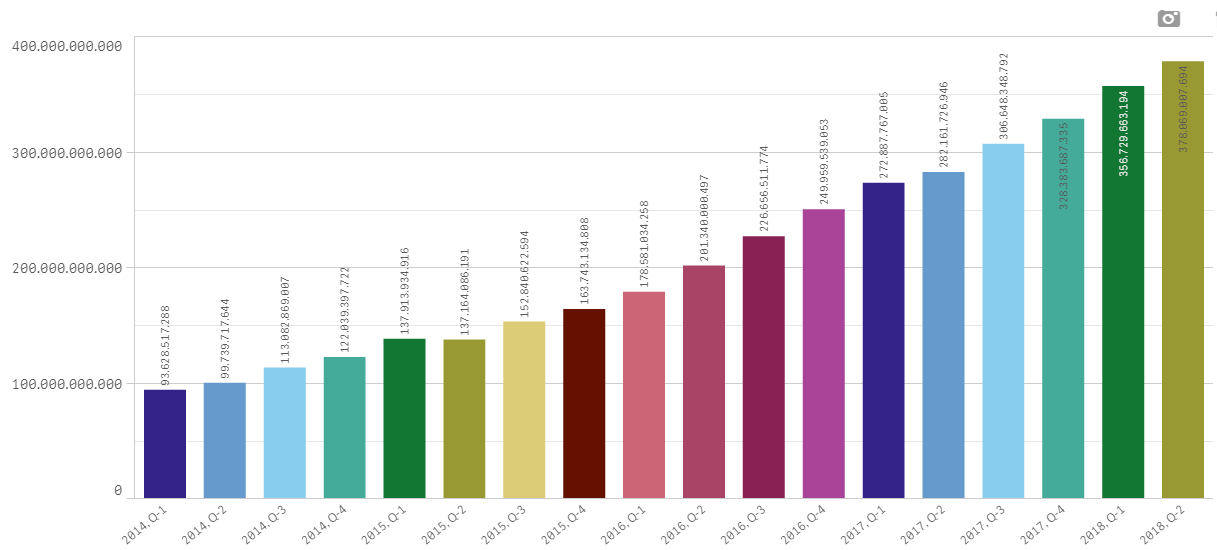
- This is seen in case you have nothing selected
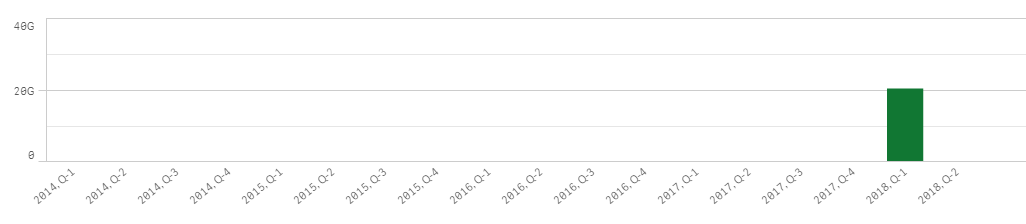
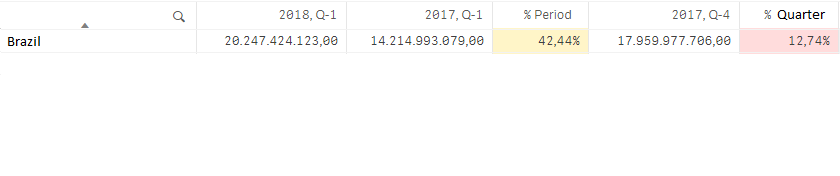
- But if I select "Brazil", it only modifies the value of the period I have selected on the dashboard:
- Mark as New
- Bookmark
- Subscribe
- Mute
- Subscribe to RSS Feed
- Permalink
- Report Inappropriate Content
What if you change the measure in the line chart to:
| MEASURE OF LINE CHART |
|---|
If ( DIM_COUNTRY = 'Germany', sum({ $<DIM_AGRUP = {'321', '743'}> } DIM_SALES) , If (DIM_COUNTRY = 'Brazil', sum({ $<DIM_AGRUP = {'453','289'}> } DIM_SALES) , If (DIM_COUNTRY = 'France', sum({ $<DIM_AGRUP = {'902', '841'}> } DIM_SALES) , If (DIM_COUNTRY = 'Italy', sum({ $<DIM_AGRUP = {'519', '732'}> } DIM_SALES) , If (DIM_COUNTRY = 'Spain', sum({ $<DIM_AGRUP = {'622', '890'}> } DIM_SALES) , If (DIM_COUNTRY = 'Colombia', sum({ $<DIM_AGRUP = {'601', '394'}> } DIM_SALES) , If (DIM_COUNTRY = 'TOTAL', sum({ $<DIM_AGRUP = {'321', '743', '453','289', '902', '841', '519', '732', '622', '890', '601', '394'}> } DIM_SALES) ))))))) |
- Mark as New
- Bookmark
- Subscribe
- Mute
- Subscribe to RSS Feed
- Permalink
- Report Inappropriate Content
Thanks but it does not help me since I need that regardless of the selection I have on the date, show me the evolution quarter by quarter.