Unlock a world of possibilities! Login now and discover the exclusive benefits awaiting you.
- Qlik Community
- :
- Forums
- :
- Analytics
- :
- New to Qlik Analytics
- :
- Showing negative values in Year over year by month
- Subscribe to RSS Feed
- Mark Topic as New
- Mark Topic as Read
- Float this Topic for Current User
- Bookmark
- Subscribe
- Mute
- Printer Friendly Page
- Mark as New
- Bookmark
- Subscribe
- Mute
- Subscribe to RSS Feed
- Permalink
- Report Inappropriate Content
Showing negative values in Year over year by month
Hi all,
I want to show a line graph where it displays Year over year by month of count of invitations.
I want to show graph for previous and current year.
I have tried with
Dimension : year and Month
Expression :
count({<DateType = {invitation},Year = {$(=max(Year))}>}invitation_id)-count({<DateType = {invitation},Year ={$(=max(Year)-1)}>}invitation_id)
I think there is wrong in my expression.So it is showing negative values I have attached qvf file .
Please help me in this regard.Any kind of help is appreciated.
Regards.
- Tags:
- year over year
- yoy
- « Previous Replies
- Next Replies »
- Mark as New
- Bookmark
- Subscribe
- Mute
- Subscribe to RSS Feed
- Permalink
- Report Inappropriate Content
after adding it click exploration icon
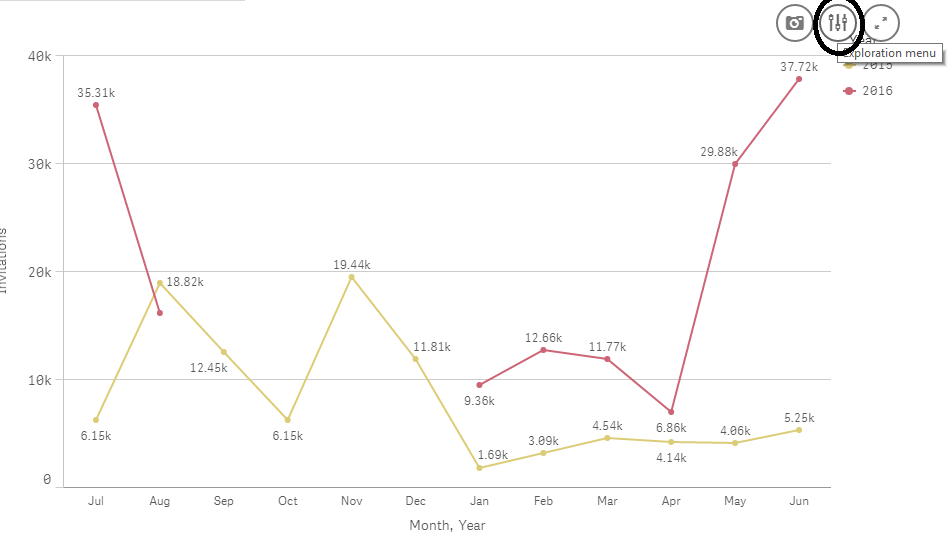
you will see the alternate expression click it
- Mark as New
- Bookmark
- Subscribe
- Mute
- Subscribe to RSS Feed
- Permalink
- Report Inappropriate Content
I can see alternate option, but the count datas dont get displayed in line Chart after adding expression in generated report.
This is used to view datas dynamically. If i have generated report it will be static right?
- « Previous Replies
- Next Replies »