Unlock a world of possibilities! Login now and discover the exclusive benefits awaiting you.
- Qlik Community
- :
- Forums
- :
- Analytics
- :
- New to Qlik Analytics
- :
- Side-by-Side Bar Chart
- Subscribe to RSS Feed
- Mark Topic as New
- Mark Topic as Read
- Float this Topic for Current User
- Bookmark
- Subscribe
- Mute
- Printer Friendly Page
- Mark as New
- Bookmark
- Subscribe
- Mute
- Subscribe to RSS Feed
- Permalink
- Report Inappropriate Content
Side-by-Side Bar Chart
I need to create a bar chart that displays different counts side-by-side, and the chart needs to be dynamic. Each count has it's own title / calculation.
'CountTitle1' => CountFunction1
'CountTitle2' => CountFunction2
...
How can I show these side-by-side in a Qlick Sense bar chart?
Thanks
- « Previous Replies
-
- 1
- 2
- Next Replies »
Accepted Solutions
- Mark as New
- Bookmark
- Subscribe
- Mute
- Subscribe to RSS Feed
- Permalink
- Report Inappropriate Content
Qlik Sense doesn't allow for bar charts without dimensions yet. So you can create a dummy dimension and then hide the axis labels and use three measures. You'll see the names of the measures in the legend which you could put on top. But if you must have labels under the bars then you'll need to use one synthetic dimension =valuelist('Active','Locked', 'New') and one measure pick(match(valuelist('Active','Locked', 'New'),'Active','Locked', 'New'), sum(IsActive), sum(IsLocked), sum(IsNew))
talk is cheap, supply exceeds demand
- Mark as New
- Bookmark
- Subscribe
- Mute
- Subscribe to RSS Feed
- Permalink
- Report Inappropriate Content
Add measures for each count. If that doesn't do what you want then you'll have to explain in more detail what it is that you do want.
talk is cheap, supply exceeds demand
- Mark as New
- Bookmark
- Subscribe
- Mute
- Subscribe to RSS Feed
- Permalink
- Report Inappropriate Content
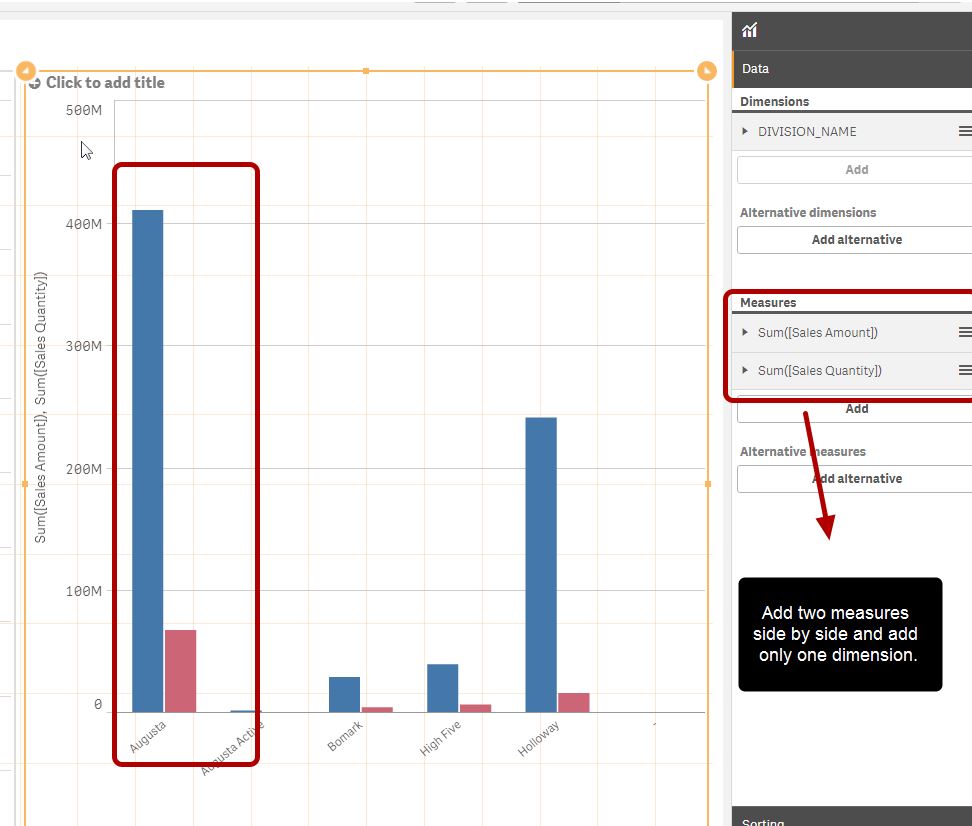
please see the attached screen shot. add two measures and one dimension
- Mark as New
- Bookmark
- Subscribe
- Mute
- Subscribe to RSS Feed
- Permalink
- Report Inappropriate Content
Hello 😃
Your example looks like this:
'Augusta' => {Sum([Sales Amount]),Sum([Sales Quantity])} // two bars
'Augusta Active' => {Sum([Sales Amount]),Sum([Sales Quantity])} // two bars
I just want this:
'Sales Amount' => Sum([Sales Amount]) // one bar
'Sales Quantity' => Sum([Sales Quantity]) // one bar
and so on... (on entire set so no group by)
- Mark as New
- Bookmark
- Subscribe
- Mute
- Subscribe to RSS Feed
- Permalink
- Report Inappropriate Content
Do you have any dimension which has one element in it in your app.
- Mark as New
- Bookmark
- Subscribe
- Mute
- Subscribe to RSS Feed
- Permalink
- Report Inappropriate Content
or else share us your QVF file and let me know what dimension and what two expressions you want to add in the qvf file.
- Mark as New
- Bookmark
- Subscribe
- Mute
- Subscribe to RSS Feed
- Permalink
- Report Inappropriate Content
Yes I tried this, however it does not yield correct titles on the x-axis. There is no 'dimension' since it is on the full set, the only way I have seen to mitigate the issue is to make the data static and load it like this.
SELECT 'Sales Amount' Title, Sum([Sales Amount]) Value FROM MyTable
UNION ALL
SELECT 'Sales Quantity' Title, Sum([Sales Quantity]) Value FROM MyTable
UNION ALL
...
Then setting the dimension to 'Title' fixes the issue, however the data won't be dynamic so it fails.
Thanks
- Mark as New
- Bookmark
- Subscribe
- Mute
- Subscribe to RSS Feed
- Permalink
- Report Inappropriate Content
The only way to do is to have a dimension with single element in it  . I could be wrong too Sorry was unable to much help
- Mark as New
- Bookmark
- Subscribe
- Mute
- Subscribe to RSS Feed
- Permalink
- Report Inappropriate Content
To clear things up suppose I wanted to make a bar chart using the following SQL:
SELECT
SUM(CASE WHEN IsActive = 1 THEN 1 ELSE 0 END) AS [Active Count],
SUM(CASE WHEN IsLocked = 1 THEN 1 ELSE 0 END) AS [Locked Count],
SUM(CASE WHEN IsNew = 1 THEN 1 ELSE 0 END) AS [New Count]
FROM
Users
Suppose I want to put those three in a bar chart called User Status. There is no dimension, and if I add a fixed dimension then that will show on the x-axis instead of the above titles. I can load it in using UNION ALLs, but as described bellow that only yields static results.
Thanks
- Mark as New
- Bookmark
- Subscribe
- Mute
- Subscribe to RSS Feed
- Permalink
- Report Inappropriate Content
if you some dimension yes that would definitely work
- « Previous Replies
-
- 1
- 2
- Next Replies »