Unlock a world of possibilities! Login now and discover the exclusive benefits awaiting you.
- Qlik Community
- :
- Forums
- :
- Analytics
- :
- New to Qlik Analytics
- :
- Re: Sort YYYY-MM in graph
Options
- Subscribe to RSS Feed
- Mark Topic as New
- Mark Topic as Read
- Float this Topic for Current User
- Bookmark
- Subscribe
- Mute
- Printer Friendly Page
Turn on suggestions
Auto-suggest helps you quickly narrow down your search results by suggesting possible matches as you type.
Showing results for
Creator
2018-10-24
10:08 AM
- Mark as New
- Bookmark
- Subscribe
- Mute
- Subscribe to RSS Feed
- Permalink
- Report Inappropriate Content
Sort YYYY-MM in graph
Hi!
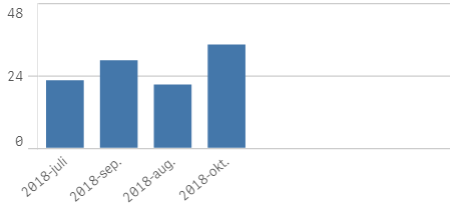
I have create Month as 'Year(event_start_time)&'-'& Month (event_start_time)as Month'.
The result will be like '2018-sep'
When i used it as x-axes dimension in a graph the order is not correct.
How can I solve this?
836 Views
4 Replies
Partner - Creator II
2018-10-24
10:31 AM
- Mark as New
- Bookmark
- Subscribe
- Mute
- Subscribe to RSS Feed
- Permalink
- Report Inappropriate Content
Try below
Sorting -> Sort by Expression
Include -> [event_start_time.autoCalendar.MonthRelNo]
763 Views
MVP
2018-10-24
10:49 AM
- Mark as New
- Bookmark
- Subscribe
- Mute
- Subscribe to RSS Feed
- Permalink
- Report Inappropriate Content
May be create the dimension like this
Date(MonthStart(event_start_time), 'YYYY-MMM') as Month
763 Views
Creator
2018-10-25
03:24 AM
Author
- Mark as New
- Bookmark
- Subscribe
- Mute
- Subscribe to RSS Feed
- Permalink
- Report Inappropriate Content
Hi!
When using this expression the dateformat is like this: '2018-09-01', not '2018--sep''
Date(MonthStart(event_start_time), 'YYYY-MMM') as Month
763 Views
Creator
2018-10-25
03:57 AM
Author
- Mark as New
- Bookmark
- Subscribe
- Mute
- Subscribe to RSS Feed
- Permalink
- Report Inappropriate Content
I found the solution.
Use 'Max(event_start_time)' as sort expression
Community Browser