Unlock a world of possibilities! Login now and discover the exclusive benefits awaiting you.
- Qlik Community
- :
- Forums
- :
- Analytics
- :
- New to Qlik Analytics
- :
- Re: Sorting By Date
- Subscribe to RSS Feed
- Mark Topic as New
- Mark Topic as Read
- Float this Topic for Current User
- Bookmark
- Subscribe
- Mute
- Printer Friendly Page
- Mark as New
- Bookmark
- Subscribe
- Mute
- Subscribe to RSS Feed
- Permalink
- Report Inappropriate Content
Sorting By Date
Hi Everyone,
Here is what I'm doing,
I've created an Inline Table :
Timeframe:
LOAD * INLINE [
TimeframeId, Timeframe
1, Monthly
2, Yearly
];
So my graphics will vary as I select a Frame,
For example, if I select Monthly, I will see the evolution of my KPI for the last 12 months, yearly is for the last 2 years evolution.
My dimension is as so :
pick(timeframeId,
month(calendar_date)&Year(calendar_date),
year(calendar_date)
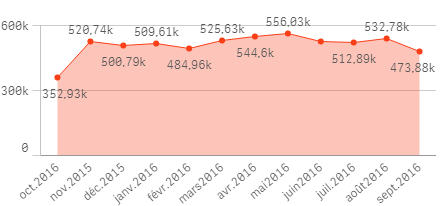
.Now, if I select Monthly, I will have this grphic( the evolution for the last 12 months):
My selected Date is 19 of October.
You can see that the sorting is wrong since October2016 should be at the end !
What I haven't understood is, when I select a date in a completely charged month, for example 20 september 2016, I will have a sorted graphic !
I've tried so many expression to counter this and still can't find a way to correct it.
Can anyone help? Thanks !
Omar,
Accepted Solutions
- Mark as New
- Bookmark
- Subscribe
- Mute
- Subscribe to RSS Feed
- Permalink
- Report Inappropriate Content
Oops I replied too soon. Instead of doing below in Dimension
month(calendar_date)&Year(calendar_date),
Why not in Script you do this
Date(Callendar-Date,'MMM-YYYY') as MonthYear
then you can sort is by the settings above
- Mark as New
- Bookmark
- Subscribe
- Mute
- Subscribe to RSS Feed
- Permalink
- Report Inappropriate Content
I think you image isn't attached properly, can you reattach please?
Best,
Sunny
- Mark as New
- Bookmark
- Subscribe
- Mute
- Subscribe to RSS Feed
- Permalink
- Report Inappropriate Content
- Mark as New
- Bookmark
- Subscribe
- Mute
- Subscribe to RSS Feed
- Permalink
- Report Inappropriate Content
If the Dates are in NumberFormat. Usually Sorting can be done with this setting.

- Mark as New
- Bookmark
- Subscribe
- Mute
- Subscribe to RSS Feed
- Permalink
- Report Inappropriate Content
Wouldn't it be easier if you created a cyclic group for your dimension instead of defining an inline table with time frames ?
- Mark as New
- Bookmark
- Subscribe
- Mute
- Subscribe to RSS Feed
- Permalink
- Report Inappropriate Content
Are you using an expression for sorting? Like a Match() function expression? I think you need to use Match(Only({1} FieldName), .....) to not allow for it to drill down based on selections.
- Mark as New
- Bookmark
- Subscribe
- Mute
- Subscribe to RSS Feed
- Permalink
- Report Inappropriate Content
Oops I replied too soon. Instead of doing below in Dimension
month(calendar_date)&Year(calendar_date),
Why not in Script you do this
Date(Callendar-Date,'MMM-YYYY') as MonthYear
then you can sort is by the settings above
- Mark as New
- Bookmark
- Subscribe
- Mute
- Subscribe to RSS Feed
- Permalink
- Report Inappropriate Content
It's the client demand; he want a dynamic dashboard in which all the graphics will change as he select a timeframe
- Mark as New
- Bookmark
- Subscribe
- Mute
- Subscribe to RSS Feed
- Permalink
- Report Inappropriate Content
Or use this as your dimension:
Pick(timeframeId,
MonthName(calendar_date),
Year(calendar_date))
- Mark as New
- Bookmark
- Subscribe
- Mute
- Subscribe to RSS Feed
- Permalink
- Report Inappropriate Content
That went reaaly good !
I've created a Month-Year field in my calendar; then changed my dimension as so :
pick(timeframeID,
date(MonthYear,'MMM/YYYY'),
year(calendardate)
)
then I sorted by ascending numeric value, and that went good !