Unlock a world of possibilities! Login now and discover the exclusive benefits awaiting you.
- Qlik Community
- :
- Forums
- :
- Analytics
- :
- New to Qlik Analytics
- :
- Re: Sorting? Legend? Filter Pane? Help!!
- Subscribe to RSS Feed
- Mark Topic as New
- Mark Topic as Read
- Float this Topic for Current User
- Bookmark
- Subscribe
- Mute
- Printer Friendly Page
- Mark as New
- Bookmark
- Subscribe
- Mute
- Subscribe to RSS Feed
- Permalink
- Report Inappropriate Content
Sorting? Legend? Filter Pane? Help!!
Hello!
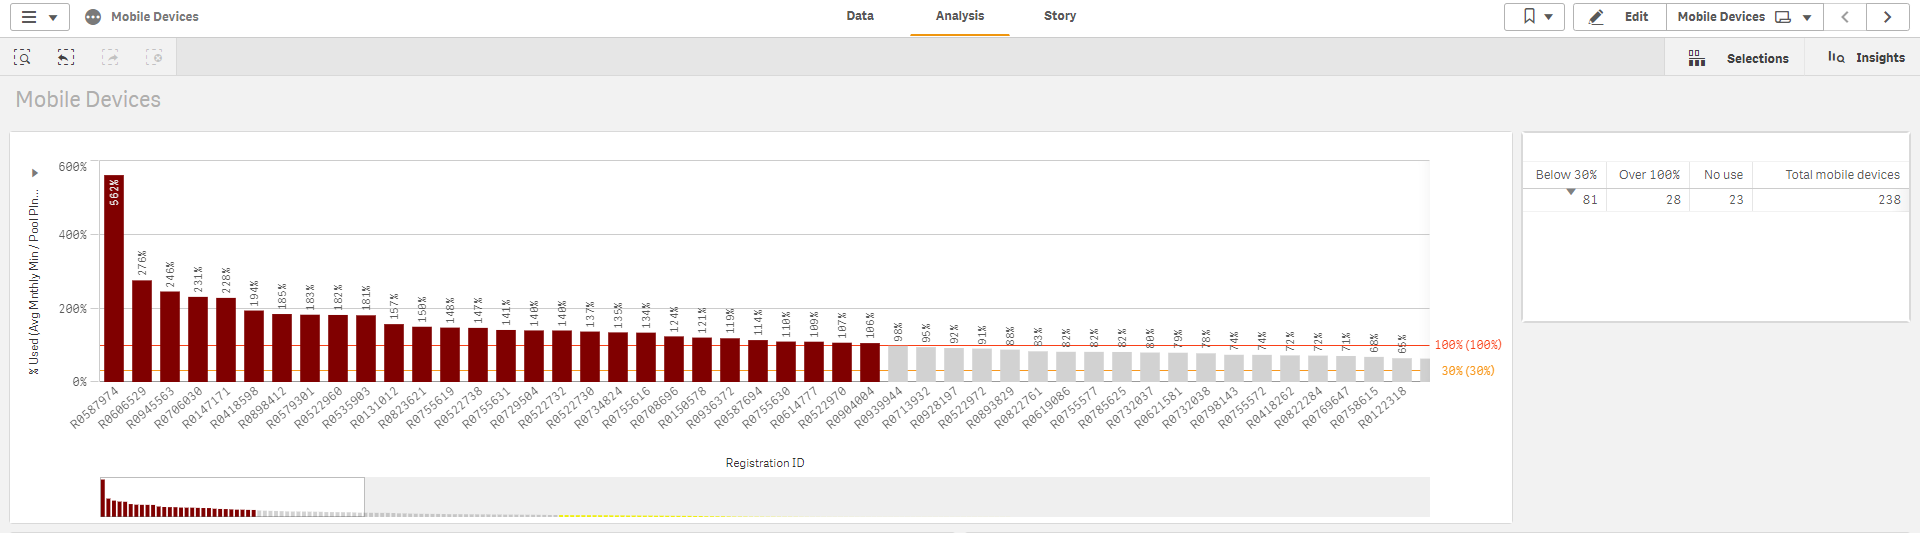
Please see attached bar chart. The chart shows mobile devices on the x-axis and percentage of minutes on mobile plan used on the y-axis. I am trying to easily show a few things--
1. The total number of devices that went over 100% of their plan minutes.
2. The total number of devices that used under 30% of their plan minutes.
3. The total number of devices that used none of their plan minutes.
I wasn't sure how to go about doing this. A filter pane? If so, what would the function/script look like? I tried a script in the filter pane, but it didn't work.
As you can see in the screenshot, I was able to color the bars according to the metrics above (red for above 100%, yellow for under 30%) and add reference lines, but I wasn't able to capture the totals, which is what I'm hoping to show somewhere.
I appreciate your help ahead of time.
Thank You,
Jamie
Accepted Solutions
- Mark as New
- Bookmark
- Subscribe
- Mute
- Subscribe to RSS Feed
- Permalink
- Report Inappropriate Content
You will probably want to use Set Analysis
Basically, a measure with a filter for each of the 3 items.
For over 100%, if [%Used] is the field containing usage, something like:
Count({<[Registration ID]={"=[%Used]>1"}>}[Registration ID])
- Mark as New
- Bookmark
- Subscribe
- Mute
- Subscribe to RSS Feed
- Permalink
- Report Inappropriate Content
It does sound like what I need from what I'm reading in the link you sent. Let me try, I'll let you know!
- Mark as New
- Bookmark
- Subscribe
- Mute
- Subscribe to RSS Feed
- Permalink
- Report Inappropriate Content
This solution worked! Follow up question--
Is there any way to see all the individual data points rather than the totals? I'm realizing the ability to peruse the individual data points would be helpful.
Attached is a screenshot of the implementation of your solution. I'm hoping to be able to click on or see all the individuals that have not used their mobile devices, for example.
Thank you, again!
- Mark as New
- Bookmark
- Subscribe
- Mute
- Subscribe to RSS Feed
- Permalink
- Report Inappropriate Content
I think I figured it out! Added a table.