Unlock a world of possibilities! Login now and discover the exclusive benefits awaiting you.
- Qlik Community
- :
- Forums
- :
- Analytics
- :
- New to Qlik Analytics
- :
- Sorting issue in line graph in Qliksense
- Subscribe to RSS Feed
- Mark Topic as New
- Mark Topic as Read
- Float this Topic for Current User
- Bookmark
- Subscribe
- Mute
- Printer Friendly Page
- Mark as New
- Bookmark
- Subscribe
- Mute
- Subscribe to RSS Feed
- Permalink
- Report Inappropriate Content
Sorting issue in line graph in Qliksense
Hi,
i have a graph which shows data for last 8 weeks, with
Dimension: Week
Expression: Count(Invitation)
Here i need to display graph to show data with order of week in ascending order. Currently week is jumbled. How to sort it in week order.
I have made all to auto sorting in Sorting Tab of Qliksense.
- « Previous Replies
-
- 1
- 2
- Next Replies »
Accepted Solutions
- Mark as New
- Bookmark
- Subscribe
- Mute
- Subscribe to RSS Feed
- Permalink
- Report Inappropriate Content
See updated APP
created a variable
MaxWeekStart = WeekStart(Max(CanonicalDate)-56)
and used this variable in your expressions
If a post helps to resolve your issue, please accept it as a Solution.
- Mark as New
- Bookmark
- Subscribe
- Mute
- Subscribe to RSS Feed
- Permalink
- Report Inappropriate Content
change to custom sorting >>> sort by Expression = Week(Datefield)
If a post helps to resolve your issue, please accept it as a Solution.
- Mark as New
- Bookmark
- Subscribe
- Mute
- Subscribe to RSS Feed
- Permalink
- Report Inappropriate Content
or else you can create an inline load for weeks and you can use in front end,
or
try to create a calculated dimension to get the output.
check below link for your u.standing
- Mark as New
- Bookmark
- Subscribe
- Mute
- Subscribe to RSS Feed
- Permalink
- Report Inappropriate Content
Thanks for Reply!
In script i have maintained canonical date as below
LOAD
Date(CanonicalDate, 'MM-DD-YYYY') AS CanonicalDate,
Year(CanonicalDate) AS Year,
date(WeekStart(CanonicalDate), 'MM-DD-YYYY') &' - '& date(WeekEnd(CanonicalDate), 'MM-DD-YYYY') as Week_Group_Year,
Load Date(MinDate + IterNo() -1 ) AS CanonicalDate While (MinDate + IterNo() - 1) <= Num(MaxDate);
and using Week_Group_Year as dimension in front end.
What i need to add to make it to display in order.
- Mark as New
- Bookmark
- Subscribe
- Mute
- Subscribe to RSS Feed
- Permalink
- Report Inappropriate Content
Hi Vineeth,
Thanks for reply!
what is Datefield?
- Mark as New
- Bookmark
- Subscribe
- Mute
- Subscribe to RSS Feed
- Permalink
- Report Inappropriate Content
May be try this expression
='Week'&Ceil(Day(the_date)/7)
- Mark as New
- Bookmark
- Subscribe
- Mute
- Subscribe to RSS Feed
- Permalink
- Report Inappropriate Content
Hi Supriya,
Could you please share your sample data or show how the week column is look like.
Thank you.
- Mark as New
- Bookmark
- Subscribe
- Mute
- Subscribe to RSS Feed
- Permalink
- Report Inappropriate Content
No, its not working.
This is what i am doing in steps:
Step1: This shows all the datas
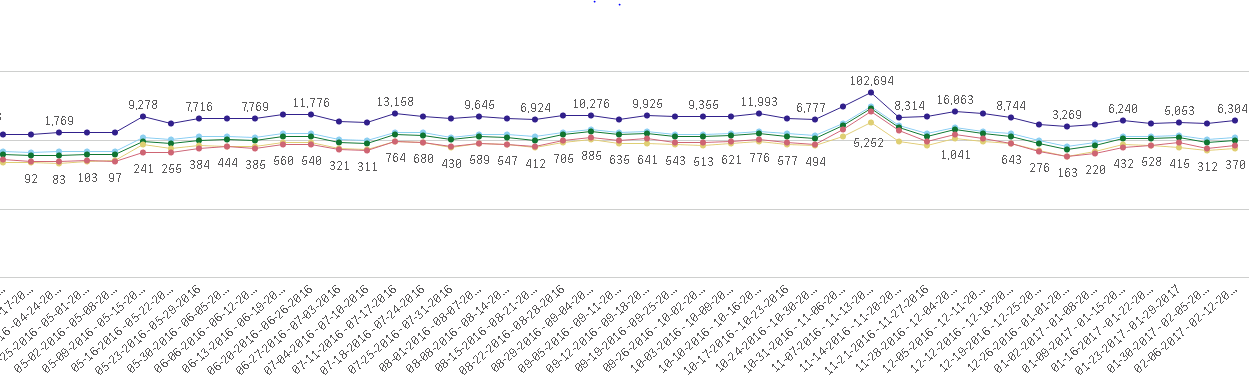
Step2: Now i limit it to show last 8 weeks, so limiting it to 8. Where chosen sorting to auto
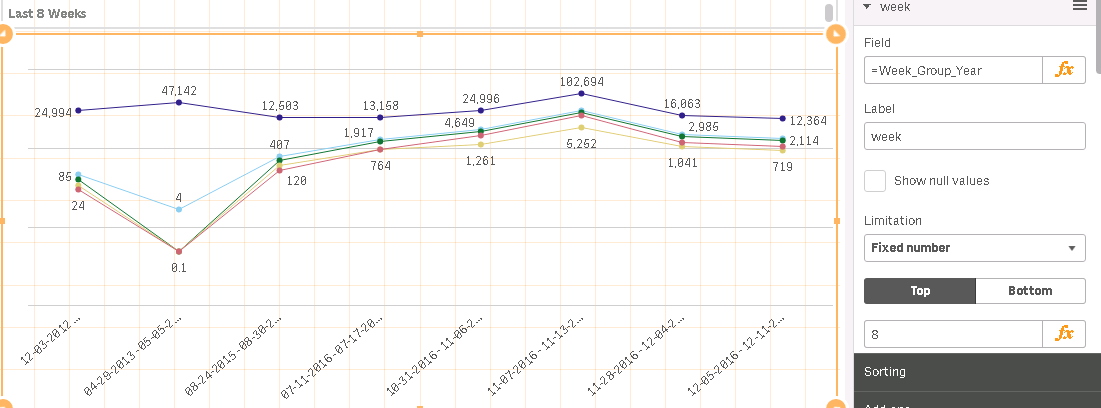
Here as you can see its not even showing latest values.
I have attached qvf file of my sample please refer it.
- Mark as New
- Bookmark
- Subscribe
- Mute
- Subscribe to RSS Feed
- Permalink
- Report Inappropriate Content
Hi Silambar,
Please find below attached qvf file.
In that i need to display latest 8 weeks data, but in there its all jumbled.
- Mark as New
- Bookmark
- Subscribe
- Mute
- Subscribe to RSS Feed
- Permalink
- Report Inappropriate Content
Hi,
Please find the application. This is what you expected right.
- « Previous Replies
-
- 1
- 2
- Next Replies »