Unlock a world of possibilities! Login now and discover the exclusive benefits awaiting you.
- Qlik Community
- :
- Forums
- :
- Analytics
- :
- New to Qlik Analytics
- :
- Stacked Bar Chart
- Subscribe to RSS Feed
- Mark Topic as New
- Mark Topic as Read
- Float this Topic for Current User
- Bookmark
- Subscribe
- Mute
- Printer Friendly Page
- Mark as New
- Bookmark
- Subscribe
- Mute
- Subscribe to RSS Feed
- Permalink
- Report Inappropriate Content
Stacked Bar Chart
Good day,
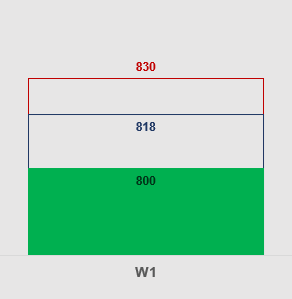
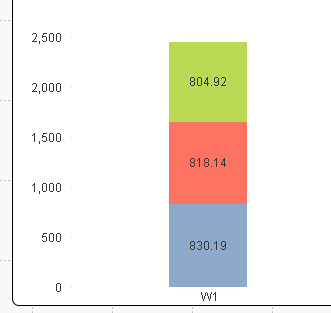
I'm replicating a chart like this (left), but I cannot make the chart - I think that is a stacked bar chart (right).
Can someone help me to replicate the chart (left)
Thanks
- Tags:
- stacked bar chart
- Mark as New
- Bookmark
- Subscribe
- Mute
- Subscribe to RSS Feed
- Permalink
- Report Inappropriate Content
Hi Mike,
you are right, this is a stacked bar chart, but according to the right picture it seems a QlikView rahter than Qlik Sense.
Can you be a more specific?
There is a check box in Sense at bar-chart properties that makes the bars stacked, further description for bar chart in Sense:
- Mark as New
- Bookmark
- Subscribe
- Mute
- Subscribe to RSS Feed
- Permalink
- Report Inappropriate Content
At the left picture the other bars shows a delta to the basic 800 value. You should create a subtract to get the data, but at the labels the value will be different.
If you have only one bar, consider the Gauge object, with bar presentation and reference lines (a bit uglier, but you can show the values right)
G.