Unlock a world of possibilities! Login now and discover the exclusive benefits awaiting you.
- Qlik Community
- :
- Forums
- :
- Analytics
- :
- New to Qlik Analytics
- :
- Re: Stacked bar chart double values
- Subscribe to RSS Feed
- Mark Topic as New
- Mark Topic as Read
- Float this Topic for Current User
- Bookmark
- Subscribe
- Mute
- Printer Friendly Page
- Mark as New
- Bookmark
- Subscribe
- Mute
- Subscribe to RSS Feed
- Permalink
- Report Inappropriate Content
Stacked bar chart double values
Hello guys, I have been wondering, Is it possible to show data points in stacked bar chart like in the picture?
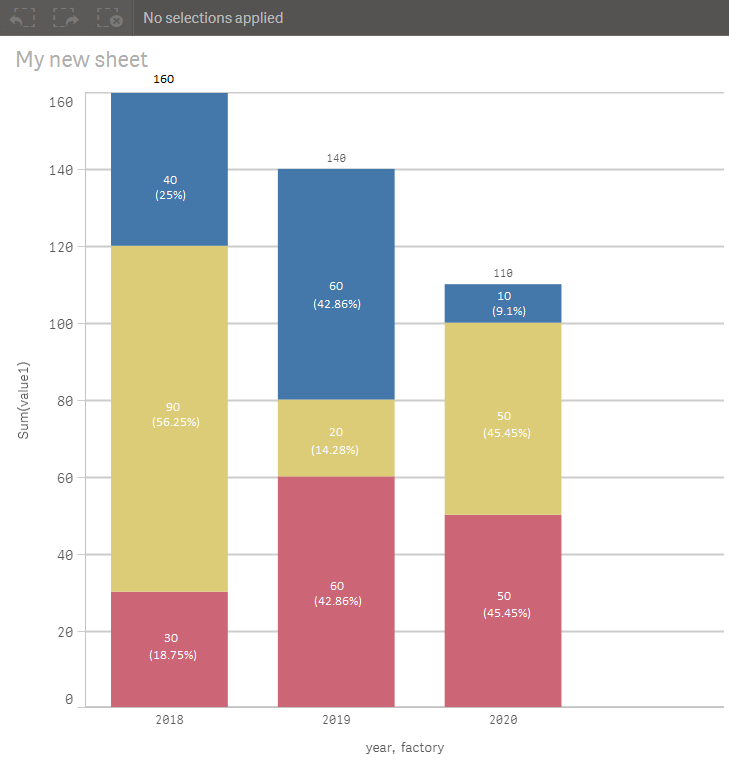
I am attaching the qliksense file as well. I have thought that this is not possible, but as I see in this picture it is?
Anybody know how to do it?
-Greetings
Acho
- « Previous Replies
-
- 1
- 2
- Next Replies »
- Mark as New
- Bookmark
- Subscribe
- Mute
- Subscribe to RSS Feed
- Permalink
- Report Inappropriate Content
It's indeed not possible to display the values for each measure in a stacked bar chart.
Which is kind of unfortunate.
The only way I could think of is using this extension:
- Mark as New
- Bookmark
- Subscribe
- Mute
- Subscribe to RSS Feed
- Permalink
- Report Inappropriate Content
I am sorry, these are Different Dimensions, only 1 measure
the 3 colors are 3 different factories.
- Mark as New
- Bookmark
- Subscribe
- Mute
- Subscribe to RSS Feed
- Permalink
- Report Inappropriate Content
u can have 2 dimensions and one measure to create a stacked bar chart with this extension
- Mark as New
- Bookmark
- Subscribe
- Mute
- Subscribe to RSS Feed
- Permalink
- Report Inappropriate Content
I have downloaded the extension and it now shows Values inside the points, but i need 2 values
like Percentage and Value
- Mark as New
- Bookmark
- Subscribe
- Mute
- Subscribe to RSS Feed
- Permalink
- Report Inappropriate Content
How to show both percent and values, can you tell me, because i couldnt do it
- Mark as New
- Bookmark
- Subscribe
- Mute
- Subscribe to RSS Feed
- Permalink
- Report Inappropriate Content
Hi Angel,
Omar suggested an extension that can help you.
- Mark as New
- Bookmark
- Subscribe
- Mute
- Subscribe to RSS Feed
- Permalink
- Report Inappropriate Content
Yes i am currently trying with it, but i can't show percentages and value points..
- Mark as New
- Bookmark
- Subscribe
- Mute
- Subscribe to RSS Feed
- Permalink
- Report Inappropriate Content
still struggling
- Mark as New
- Bookmark
- Subscribe
- Mute
- Subscribe to RSS Feed
- Permalink
- Report Inappropriate Content
the only thing I can think of is sthing like this: (but no stacked and no colors..)
I have
Dim1 and Dim2
Dim1=Dim1
Dim2=Dim2&': '&(aggr(num((sum(Expression1)/sum(total Expression1)) ,'# ##0,00%'),Dim2))
Measure = sum(Expression1)
color: unique color
result :
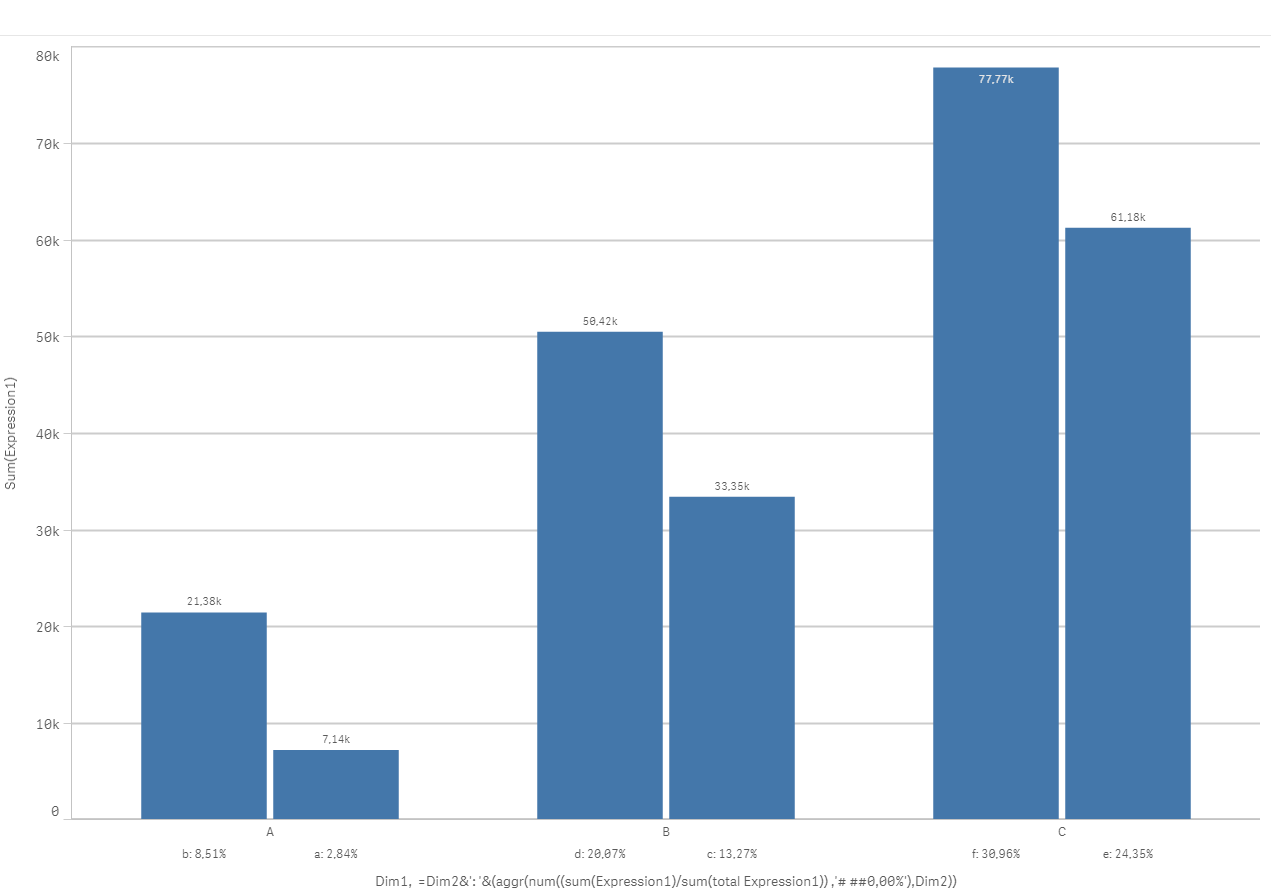
Hope this could help u...
- « Previous Replies
-
- 1
- 2
- Next Replies »