Unlock a world of possibilities! Login now and discover the exclusive benefits awaiting you.
- Qlik Community
- :
- Forums
- :
- Analytics
- :
- New to Qlik Analytics
- :
- Re: Stacked chart in qliksense
- Subscribe to RSS Feed
- Mark Topic as New
- Mark Topic as Read
- Float this Topic for Current User
- Bookmark
- Subscribe
- Mute
- Printer Friendly Page
- Mark as New
- Bookmark
- Subscribe
- Mute
- Subscribe to RSS Feed
- Permalink
- Report Inappropriate Content
Stacked chart in qliksense
Hi,
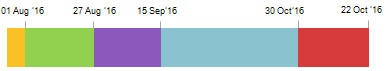
Can we have below kind of chart in qliksense where date and different color shows different phases of project
how to implement it.
Thanks!
- Mark as New
- Bookmark
- Subscribe
- Mute
- Subscribe to RSS Feed
- Permalink
- Report Inappropriate Content
The stacked bar itself isn't a problem. But I don't think you get the labels with the dates added to it. Perhaps this extension is an acceptable alternative: QlikSense Extension Timeline
talk is cheap, supply exceeds demand
- Mark as New
- Bookmark
- Subscribe
- Mute
- Subscribe to RSS Feed
- Permalink
- Report Inappropriate Content
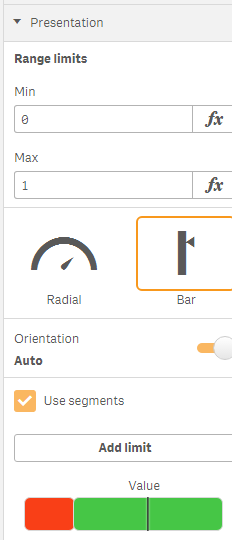
An alternative might be to use a gauge bar chart and set limits in your different colours for your project phases.
- Mark as New
- Bookmark
- Subscribe
- Mute
- Subscribe to RSS Feed
- Permalink
- Report Inappropriate Content
Check this Timeline extension Qlik Branch
This will help you to achieve similar kind of output.
- Mark as New
- Bookmark
- Subscribe
- Mute
- Subscribe to RSS Feed
- Permalink
- Report Inappropriate Content
but, i think there is no option to add more than one expression in gauge and also through limit as well we can add single expression but, i have multiple so, i don't think it will work.
- Mark as New
- Bookmark
- Subscribe
- Mute
- Subscribe to RSS Feed
- Permalink
- Report Inappropriate Content
Your expression would be where you are as a black line your phases in the project would be coloured limits.
Your right this would only work for a single project view at a time which you could load through a variable.
Wish we had trellis capabilities in here like we do in View.