Unlock a world of possibilities! Login now and discover the exclusive benefits awaiting you.
- Qlik Community
- :
- Forums
- :
- Analytics
- :
- New to Qlik Analytics
- :
- Stacked double bar chart
- Subscribe to RSS Feed
- Mark Topic as New
- Mark Topic as Read
- Float this Topic for Current User
- Bookmark
- Subscribe
- Mute
- Printer Friendly Page
- Mark as New
- Bookmark
- Subscribe
- Mute
- Subscribe to RSS Feed
- Permalink
- Report Inappropriate Content
Stacked double bar chart
Hi,
I am new to the qlik sense and I wanted to created Stacked Double Bar graph in qlik sense.
I have 2 Dimension and 1 measure and i want to represent both stack side by side on the basis of Expression
Say Dimensions are Month & Activity
and Expressions are Sum([Transaction Duration]) & avg([Transaction Duration])
Can anybody help me out on this case?
Thanks in Advance
- Mark as New
- Bookmark
- Subscribe
- Mute
- Subscribe to RSS Feed
- Permalink
- Report Inappropriate Content
Hi,
Sorry i don't think it is possible via the standard charts.
Might be worth checking for extentions?
Mark
- Mark as New
- Bookmark
- Subscribe
- Mute
- Subscribe to RSS Feed
- Permalink
- Report Inappropriate Content
Hi Nitin
i'am affraid you can't achieve this with standart object bar chart in Qlik Sense
The BAR chart Object with 2 dimensions take only 1 mesure.
Regards
- Mark as New
- Bookmark
- Subscribe
- Mute
- Subscribe to RSS Feed
- Permalink
- Report Inappropriate Content
Hi Nithin,
Yes I think its possible to an extent. But you will not be able to have the text in hte middle of the bar.
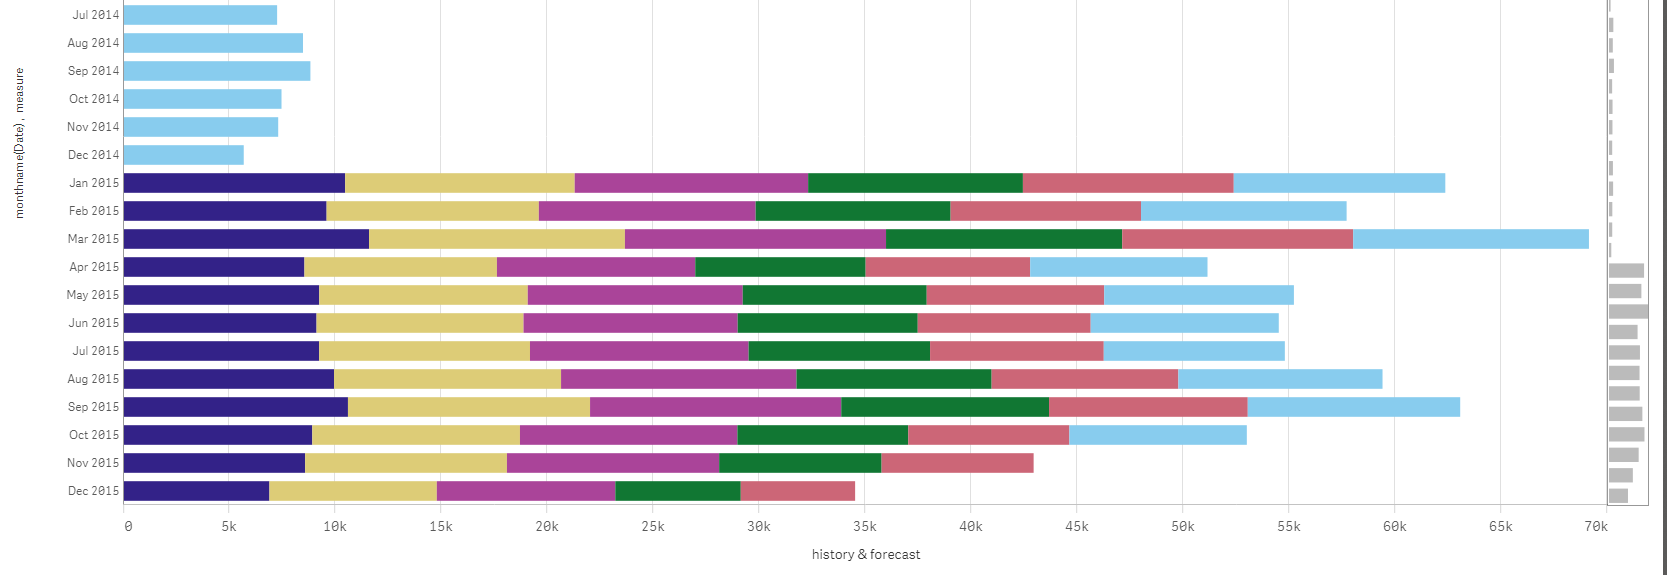
I have used 6 measures here.
Thanks,
Sangram.
- Mark as New
- Bookmark
- Subscribe
- Mute
- Subscribe to RSS Feed
- Permalink
- Report Inappropriate Content
Hi Sangram,
I have used text on the graph just for the info.
Thanks,
Nitin Roman
- Mark as New
- Bookmark
- Subscribe
- Mute
- Subscribe to RSS Feed
- Permalink
- Report Inappropriate Content
Hi Bruno,
Thanks for the reply.
- Mark as New
- Bookmark
- Subscribe
- Mute
- Subscribe to RSS Feed
- Permalink
- Report Inappropriate Content
Hi Mark,
Thanks for your reply, Can you give some pointers towards the Bar graph extensions?
Thanks,
Nitin Roman
- Mark as New
- Bookmark
- Subscribe
- Mute
- Subscribe to RSS Feed
- Permalink
- Report Inappropriate Content
Hi Nithin,
Then Yes, you can display multiple measures this way.
Thanks,
Sangram.