Unlock a world of possibilities! Login now and discover the exclusive benefits awaiting you.
- Qlik Community
- :
- Forums
- :
- Analytics
- :
- New to Qlik Analytics
- :
- Staircase Effect of data in Qlik Sense
- Subscribe to RSS Feed
- Mark Topic as New
- Mark Topic as Read
- Float this Topic for Current User
- Bookmark
- Subscribe
- Mute
- Printer Friendly Page
- Mark as New
- Bookmark
- Subscribe
- Mute
- Subscribe to RSS Feed
- Permalink
- Report Inappropriate Content
Staircase Effect of data in Qlik Sense
Hello All,
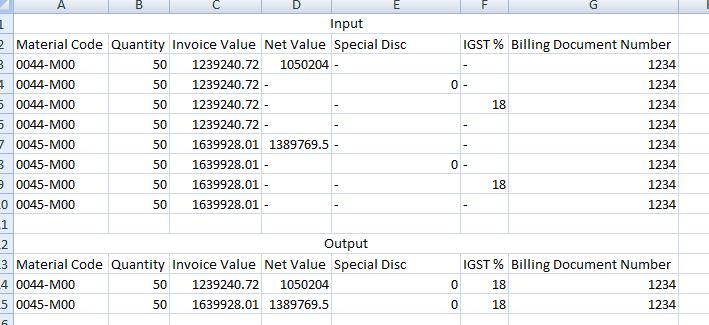
I have the following output that is showing a staircase effect.
I wanted the output as shown below.
The values will be checked on the basis of "Billing Document Number"
Thanks in Advance
Accepted Solutions
- Mark as New
- Bookmark
- Subscribe
- Mute
- Subscribe to RSS Feed
- Permalink
- Report Inappropriate Content
You would need to do something like this in your load script:
LOAD
[Billing Document Number],
[Material Code],
[Quantity],
Only([Invoice Value],
Sum([Net Value]) AS [Net Value],
Sum([Special Disc]) AS [Special Disc],
Num([IGST %],'0%','.',',') AS [IGST %]
FROM
"<your-excel-file>.xlsx" (ooxml......)
GROUP BY
[Billing Document Number],
[Material Code],
[Quantity]
;
However you can just read the Excel file as it is instead (as an alternative). Then you do the same in the chart as you would do in the load script.In the app you then have to select the three first fields as dimensions and the rest as measures with the expressions kept the same as in the load script above. The dimensions in a chart has an implicit group by so you won't need to specify that as you have to in the load script.
I guess the load script variant is cleaner anyway....