Unlock a world of possibilities! Login now and discover the exclusive benefits awaiting you.
- Qlik Community
- :
- Forums
- :
- Analytics
- :
- New to Qlik Analytics
- :
- Re: Static reference line
- Subscribe to RSS Feed
- Mark Topic as New
- Mark Topic as Read
- Float this Topic for Current User
- Bookmark
- Subscribe
- Mute
- Printer Friendly Page
- Mark as New
- Bookmark
- Subscribe
- Mute
- Subscribe to RSS Feed
- Permalink
- Report Inappropriate Content
Static reference line
Dear community,
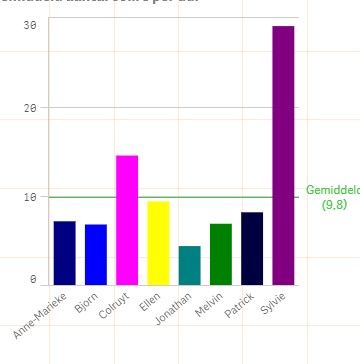
For a client of mine we hav this reference line:
=avg(total aggr(sum($(vColli))/$(vDag),Datum, magazijnier))
Now if I Select something, the line adjusts.
But actually it should keep the total average line even when selecting a single person.
Here's a visual of the graph:
Thanks in advance
- Tags:
- reference line
Accepted Solutions
- Mark as New
- Bookmark
- Subscribe
- Mute
- Subscribe to RSS Feed
- Permalink
- Report Inappropriate Content
Or this
=Avg(TOTAL {1} Aggr(Sum({1} $(vColli))/$(vDag), Datum, magazijnier))
- Mark as New
- Bookmark
- Subscribe
- Mute
- Subscribe to RSS Feed
- Permalink
- Report Inappropriate Content
maybe this:
=avg( {1} total aggr(sum($(vColli))/$(vDag),Datum, magazijnier))
I hope it helps.
- Mark as New
- Bookmark
- Subscribe
- Mute
- Subscribe to RSS Feed
- Permalink
- Report Inappropriate Content
Or this
=Avg(TOTAL {1} Aggr(Sum({1} $(vColli))/$(vDag), Datum, magazijnier))
- Mark as New
- Bookmark
- Subscribe
- Mute
- Subscribe to RSS Feed
- Permalink
- Report Inappropriate Content
=avg( total {1} aggr(sum({1}$(vColli))/$(vDag),Datum, magazijnier))
I think in Variable's expresssion also, you need to modify:
$(vColli)
$(vDag)
- Mark as New
- Bookmark
- Subscribe
- Mute
- Subscribe to RSS Feed
- Permalink
- Report Inappropriate Content
Gives back a completely different result :s
- Mark as New
- Bookmark
- Subscribe
- Mute
- Subscribe to RSS Feed
- Permalink
- Report Inappropriate Content
Sorry for asking,
modify how exactly?
thanks
- Mark as New
- Bookmark
- Subscribe
- Mute
- Subscribe to RSS Feed
- Permalink
- Report Inappropriate Content
Amit is correct, what exactly vColli and vDag have as values?
- Mark as New
- Bookmark
- Subscribe
- Mute
- Subscribe to RSS Feed
- Permalink
- Report Inappropriate Content
Would you be able to share a sample or an image to show what your issue is?
- Mark as New
- Bookmark
- Subscribe
- Mute
- Subscribe to RSS Feed
- Permalink
- Report Inappropriate Content
Vcolli is a numeric value, if you have a crate with 10 articles in it, 1 article = 1colli
Vdag is a date (dag = day)