Unlock a world of possibilities! Login now and discover the exclusive benefits awaiting you.
- Qlik Community
- :
- Forums
- :
- Analytics
- :
- New to Qlik Analytics
- :
- Statistics Box in QlikSense
- Subscribe to RSS Feed
- Mark Topic as New
- Mark Topic as Read
- Float this Topic for Current User
- Bookmark
- Subscribe
- Mute
- Printer Friendly Page
- Mark as New
- Bookmark
- Subscribe
- Mute
- Subscribe to RSS Feed
- Permalink
- Report Inappropriate Content
Statistics Box in QlikSense
How to create a Statistics Box in QlikSense?
Accepted Solutions
- Mark as New
- Bookmark
- Subscribe
- Mute
- Subscribe to RSS Feed
- Permalink
- Report Inappropriate Content
Ankusha,
The option isn't available in Sense. But, we show this information in a KPI object.
- Mark as New
- Bookmark
- Subscribe
- Mute
- Subscribe to RSS Feed
- Permalink
- Report Inappropriate Content
Could explain in detail?
- Mark as New
- Bookmark
- Subscribe
- Mute
- Subscribe to RSS Feed
- Permalink
- Report Inappropriate Content
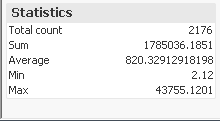
This is the Statistic box that can be created in Qlikview by directly clicking on new sheet object -> Statistic box.
Can we do same in Qlik Sense? If not, is there any alternate method?
- Mark as New
- Bookmark
- Subscribe
- Mute
- Subscribe to RSS Feed
- Permalink
- Report Inappropriate Content
Ankusha,
The option isn't available in Sense. But, we show this information in a KPI object.
- Mark as New
- Bookmark
- Subscribe
- Mute
- Subscribe to RSS Feed
- Permalink
- Report Inappropriate Content
or else you can take text objects and show .
- Mark as New
- Bookmark
- Subscribe
- Mute
- Subscribe to RSS Feed
- Permalink
- Report Inappropriate Content
Hi Mohan,
I know this is marked as answer but I simply don't get how I get these other informations in.
When I create a KPI object, it only shows one aggregation (the one I choose when creating the object).
Can you assist me and tell me how to get these other informations (min, max, avg, count) in this box?
Best regards
Tamara
- Mark as New
- Bookmark
- Subscribe
- Mute
- Subscribe to RSS Feed
- Permalink
- Report Inappropriate Content
Hi Tamara,
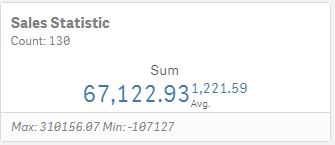
You can display two measure on that object (on the picture these measures are the sum and the average),
the count is implemented by subtitle - you can add expression to it, and the max/min below is footer with expression. You can find these settings at the properties panel of object at right.
G.
- Mark as New
- Bookmark
- Subscribe
- Mute
- Subscribe to RSS Feed
- Permalink
- Report Inappropriate Content
Hi Gabor,
thank you very much for this super quick response.
Works perfectly!
Best regards
Tamara
- Mark as New
- Bookmark
- Subscribe
- Mute
- Subscribe to RSS Feed
- Permalink
- Report Inappropriate Content
I'm happy to read it 