Unlock a world of possibilities! Login now and discover the exclusive benefits awaiting you.
- Qlik Community
- :
- Forums
- :
- Analytics
- :
- New to Qlik Analytics
- :
- Strange behavior in QlikSense trying to create 100...
- Subscribe to RSS Feed
- Mark Topic as New
- Mark Topic as Read
- Float this Topic for Current User
- Bookmark
- Subscribe
- Mute
- Printer Friendly Page
- Mark as New
- Bookmark
- Subscribe
- Mute
- Subscribe to RSS Feed
- Permalink
- Report Inappropriate Content
Strange behavior in QlikSense trying to create 100% stacked bar
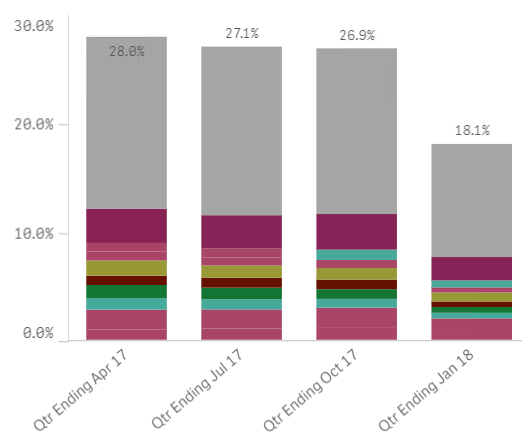
I have a really simple set analysis expression below that is dividing current value vs total value to give a % out of 100.
sum([Value])/sum(TOTAL {<[GroupName]=>} [Value])
For some reason when I plot this on a bar chart with 2 dimensions: Period Quarters (PeriodQTRName) + Group (GroupName) it breaks the 100% total by each of the 4 quarters. So if you total all the % (28.0 + 27.1 + 26.9 + 18.1) = 100%. I
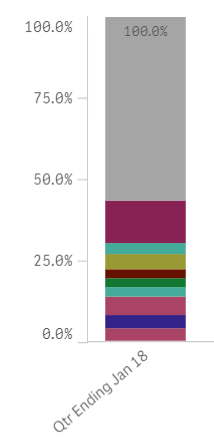
And If I just filter for 1 quarter it is working correctly:
I want it to be 100% for each of the quarters. Any ideas why this is happening and how to fix this?
Thanks
- Mark as New
- Bookmark
- Subscribe
- Mute
- Subscribe to RSS Feed
- Permalink
- Report Inappropriate Content
Try this
Sum([Value])/Sum(TOTAL <PeriodQTRName> {<[GroupName]=>} [Value])
- Mark as New
- Bookmark
- Subscribe
- Mute
- Subscribe to RSS Feed
- Permalink
- Report Inappropriate Content
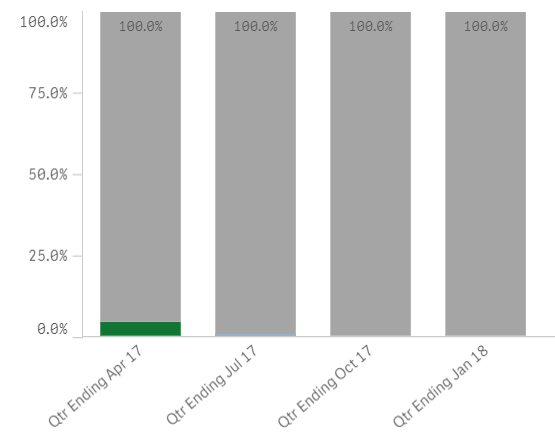
This does appear to be a step closer implementing: Sum([Value])/Sum(TOTAL <PeriodQTRName> {<[GroupName]=>} [Value])
and adding a range 0 to 1 produces the right effect I need however the groupings aren't appearing now. I am summing top 10 and putting everything else into the other bucket (grey).
Any ideas?
Thanks
- Mark as New
- Bookmark
- Subscribe
- Mute
- Subscribe to RSS Feed
- Permalink
- Report Inappropriate Content
Would you be able to share a sample?