Unlock a world of possibilities! Login now and discover the exclusive benefits awaiting you.
- Qlik Community
- :
- Forums
- :
- Analytics
- :
- New to Qlik Analytics
- :
- Subtotal in Pivot Table
- Subscribe to RSS Feed
- Mark Topic as New
- Mark Topic as Read
- Float this Topic for Current User
- Bookmark
- Subscribe
- Mute
- Printer Friendly Page
- Mark as New
- Bookmark
- Subscribe
- Mute
- Subscribe to RSS Feed
- Permalink
- Report Inappropriate Content
Subtotal in Pivot Table
Hi!
I'm really struggling with this. Need to figure out how to add specific subtotals to pivot tables at Qlik Sense
I have a Pivot Table with 13 LINES. (like the example below)
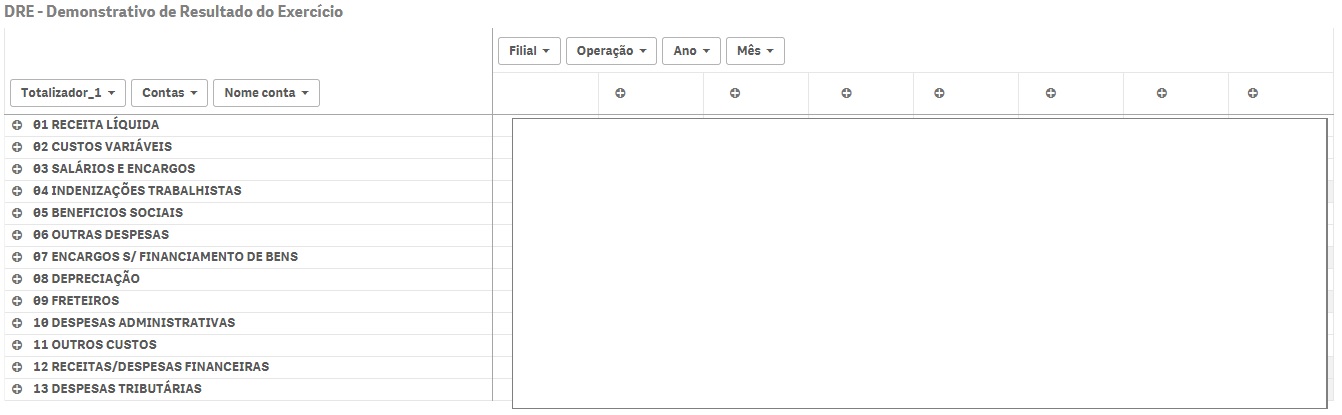
And need to create a calculated LINE to SUM the existing lines 02, 03, 04, 05, 06, 07, 08, 09, and define the Label as "XYZ".
Of course, the SUM must be based on the selections made. Like, "I've selected the branch of "City X" and want the LINE to SUM the lines 02, 03, ... 08 and 09 that correspond to the branch "City X".
Anyone know how to write the script to calculate this?
Accepted Solutions
- Mark as New
- Bookmark
- Subscribe
- Mute
- Subscribe to RSS Feed
- Permalink
- Report Inappropriate Content
Maybe you can create a table in your data model with the associations needed, i.e. create a table like
NEWDIM:
LOAD Totalizador_1,
Totalizador_1 AS NewTotalizador
RESIDENT YourTableWithTotalizador_1;
Concatenate (NEWDIM)
LOAD Totalizador_1,
'XYZ' AS NewTotalizador
RESIDENT YourTableWithTotalizador_1
WHERE WildMatch(Totalizador_1,'02*','03*','04*','05*','06*','07*','08*','09*');
Then use NewTotalizador as your dimension in your chart.
- Mark as New
- Bookmark
- Subscribe
- Mute
- Subscribe to RSS Feed
- Permalink
- Report Inappropriate Content
Hey swuehl!
Thank you for your reply and your attention.
I need to apologise in advance for my ignorance. Could you give a little more detailed instructions?
Should I do it like the img below?
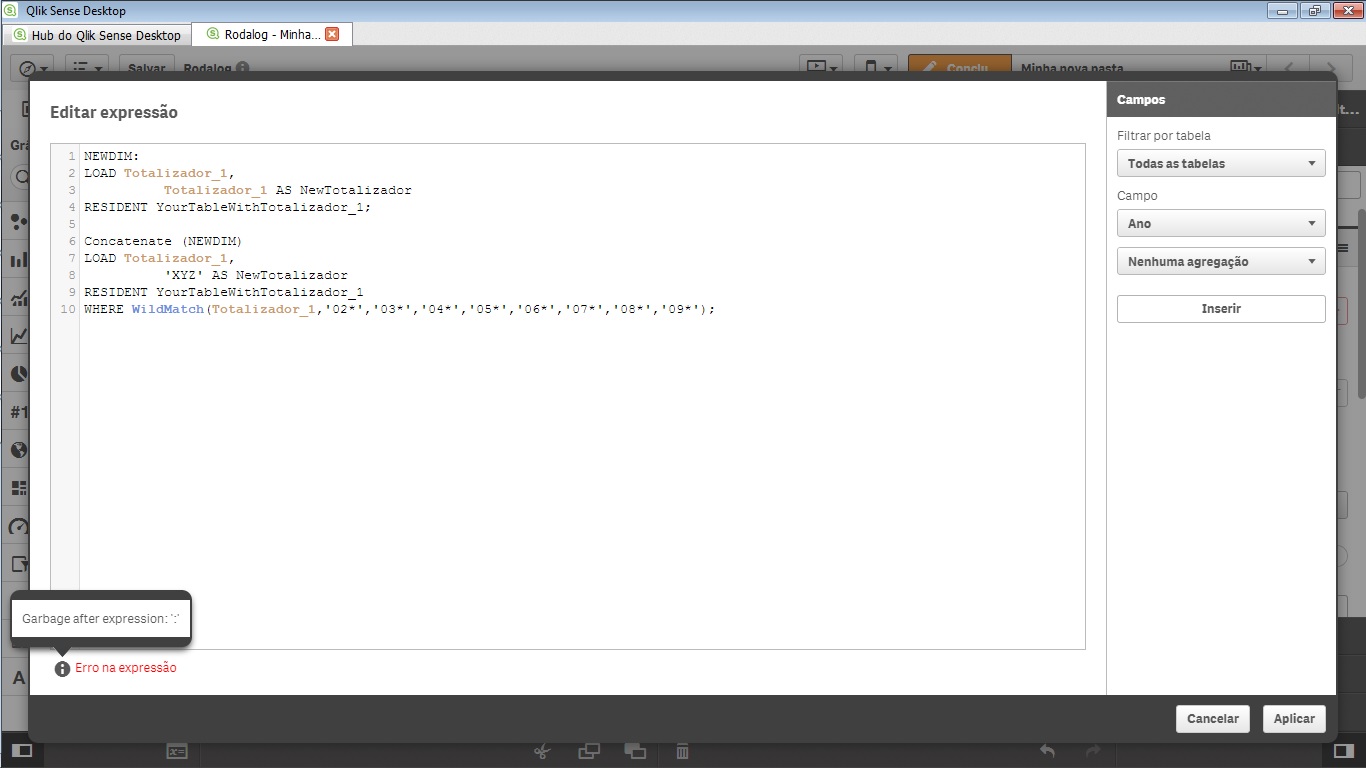
In this image, I've selected to add a new line in the pivot table and inserted the script.
Again, I apologise for my ignorance. Haha, I'm trying to get rid of it (ignorance). Appreciated your attention and your help.
- Mark as New
- Bookmark
- Subscribe
- Mute
- Subscribe to RSS Feed
- Permalink
- Report Inappropriate Content
No, what I've posted above was more intended as an addition to your current load script (data editor).
It should create a new field in the data model with appropriate associations to create your new line summing up the current lines (02 to 09).
- Mark as New
- Bookmark
- Subscribe
- Mute
- Subscribe to RSS Feed
- Permalink
- Report Inappropriate Content
Thank you very much swuehl!
I've tryied your code and I don't know why, it didn't worked. (High probability that I've done something wrong.)
I've added a calculated dimension as a Line and added the code you've provided me: "WildMatch('01*',.....)
And I added "Pick" before WildMatch.
It worked to "group" the lines that I had.
Seriously, when I saw what it did, I almost fell out of my chair.
That was the first code that i tryied and WORKED.
So I Got 3 Major Groups.
And Thats what I asked for in this post, so I Thank you and i defined your answer as the correct answer.
What I need now is to make Line 1 - Line 2 = Line 3
And Line 3 - Line 4 = Line 5.
(All in the same Colum)
Detail: Line 3 and Line 5 don't exist yet. They are going to be Purely Calculated Dimensions based on the selections (the selecions influences the Lines 1, 2 and 4.)
- Mark as New
- Bookmark
- Subscribe
- Mute
- Subscribe to RSS Feed
- Permalink
- Report Inappropriate Content
swuehl,
As you've aswered this question. I selectec it as "correct answer".
I've made another post with a slightly different question (that i've explained here at my last post) so, if you will, you can answer ir there to receive de credits for it. Here: (((Line1 - Line2) = Line3) - Line4) = Line5 (Pivot Table)