Unlock a world of possibilities! Login now and discover the exclusive benefits awaiting you.
- Qlik Community
- :
- Forums
- :
- Analytics
- :
- New to Qlik Analytics
- :
- Suitable graph to present the data?
Options
- Subscribe to RSS Feed
- Mark Topic as New
- Mark Topic as Read
- Float this Topic for Current User
- Bookmark
- Subscribe
- Mute
- Printer Friendly Page
Turn on suggestions
Auto-suggest helps you quickly narrow down your search results by suggesting possible matches as you type.
Showing results for
Contributor III
2019-03-06
01:52 AM
- Mark as New
- Bookmark
- Subscribe
- Mute
- Subscribe to RSS Feed
- Permalink
- Report Inappropriate Content
Suitable graph to present the data?
Hello experts,
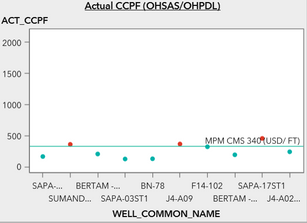
I want to make a graph exactly like the picture above. The visual above is using SAS Visual Analytics.
Can you guys suggest what graph is suitable in Qlik Sense to show above graph?
Really need your help and thank you in advance!
Regards,
Nurul
387 Views
5 Replies
Specialist III
2019-03-06
01:57 AM
- Mark as New
- Bookmark
- Subscribe
- Mute
- Subscribe to RSS Feed
- Permalink
- Report Inappropriate Content
combo chart..dont choose bar
u have option to choose line and mark
Channa
383 Views
Specialist III
2019-03-06
01:58 AM
- Mark as New
- Bookmark
- Subscribe
- Mute
- Subscribe to RSS Feed
- Permalink
- Report Inappropriate Content
is that line is regression line or reference line
Channa
381 Views
Contributor III
2019-03-06
02:00 AM
Author
- Mark as New
- Bookmark
- Subscribe
- Mute
- Subscribe to RSS Feed
- Permalink
- Report Inappropriate Content
but combo graph cannot add reference line 😞
380 Views
Contributor III
2019-03-06
02:00 AM
Author
- Mark as New
- Bookmark
- Subscribe
- Mute
- Subscribe to RSS Feed
- Permalink
- Report Inappropriate Content
it is a reference line
379 Views
Specialist III
2019-03-06
02:07 AM
- Mark as New
- Bookmark
- Subscribe
- Mute
- Subscribe to RSS Feed
- Permalink
- Report Inappropriate Content
no reference but you can add line with static or aggregate value
in measure u put 30...you will get straight line
which you can show as reference line
Channa
369 Views
Community Browser
