Unlock a world of possibilities! Login now and discover the exclusive benefits awaiting you.
- Qlik Community
- :
- Forums
- :
- Analytics
- :
- New to Qlik Analytics
- :
- Re: Sum up the worth of dimension
- Subscribe to RSS Feed
- Mark Topic as New
- Mark Topic as Read
- Float this Topic for Current User
- Bookmark
- Subscribe
- Mute
- Printer Friendly Page
- Mark as New
- Bookmark
- Subscribe
- Mute
- Subscribe to RSS Feed
- Permalink
- Report Inappropriate Content
Sum up the worth of dimension
Hi,
see attachment, please.
I want to show the sum up from the month on the x axis.
Example:
| Monat | Sonnentage |
| Januar | 4 |
| Februar | 3 |
| März | 8 |
| April | 9 |
In the graph i want to show this:
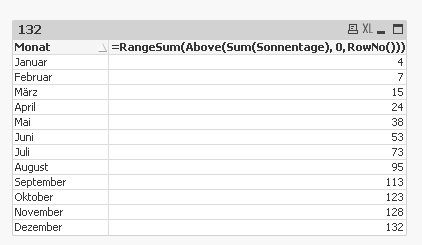
Januar = 4 | Februar = 7 | März = 15 | April = 24
How can i do that?
I don´t want to show:
Januar = 4 | Februar = 3 | März = 8 | April = 9
Best regards
Homer
- Mark as New
- Bookmark
- Subscribe
- Mute
- Subscribe to RSS Feed
- Permalink
- Report Inappropriate Content
Use this expression may be:
RangeSum(Above(Sum(Sonnentage), 0, RowNo()))
- Mark as New
- Bookmark
- Subscribe
- Mute
- Subscribe to RSS Feed
- Permalink
- Report Inappropriate Content
Hi,
thank you. Is there another easy way without formulas?
Best regards
Homer
- Mark as New
- Bookmark
- Subscribe
- Mute
- Subscribe to RSS Feed
- Permalink
- Report Inappropriate Content
If this is in the straight table, then yes there is another way using Full Accumulation. But if its any other chart like a bar chart or line chart. Then no, this is the only way (in addition to doing this in the script)
Update: Just realized that this is sense. I think the RangeSum(Above()) is the only way to do this in sense. A sense expert may be able to give you a better response.