Unlock a world of possibilities! Login now and discover the exclusive benefits awaiting you.
- Qlik Community
- :
- Forums
- :
- Analytics
- :
- New to Qlik Analytics
- :
- Text on Axis
- Subscribe to RSS Feed
- Mark Topic as New
- Mark Topic as Read
- Float this Topic for Current User
- Bookmark
- Subscribe
- Mute
- Printer Friendly Page
- Mark as New
- Bookmark
- Subscribe
- Mute
- Subscribe to RSS Feed
- Permalink
- Report Inappropriate Content
Text on Axis
Hi all,
I have a bar chart I wants to add one expression as Text on axis please suggest any one how can I achieve this in Qlik Sense .
Thanks,
Vikas
Accepted Solutions
- Mark as New
- Bookmark
- Subscribe
- Mute
- Subscribe to RSS Feed
- Permalink
- Report Inappropriate Content
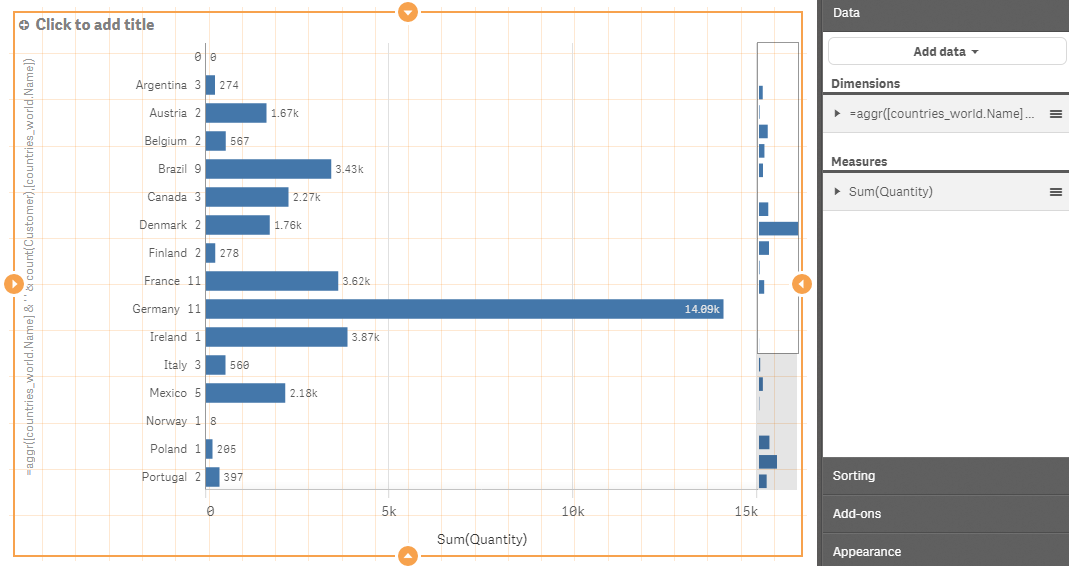
I think that is possible. Below i replaced my dimension with an expression: I added a measure of count(customer) to the dimension label . Just make sure to wrap it in an aggr() using your original dimension as the 2nd argument for the function.
aggr([countries_world.Name] & ' ' & count(Customer),[countries_world.Name])
- Mark as New
- Bookmark
- Subscribe
- Mute
- Subscribe to RSS Feed
- Permalink
- Report Inappropriate Content
Thanks, Jonathan.