Unlock a world of possibilities! Login now and discover the exclusive benefits awaiting you.
- Qlik Community
- :
- Forums
- :
- Analytics
- :
- New to Qlik Analytics
- :
- Top 10 bar graph not displaying properly
- Subscribe to RSS Feed
- Mark Topic as New
- Mark Topic as Read
- Float this Topic for Current User
- Bookmark
- Subscribe
- Mute
- Printer Friendly Page
- Mark as New
- Bookmark
- Subscribe
- Mute
- Subscribe to RSS Feed
- Permalink
- Report Inappropriate Content
Top 10 bar graph not displaying properly
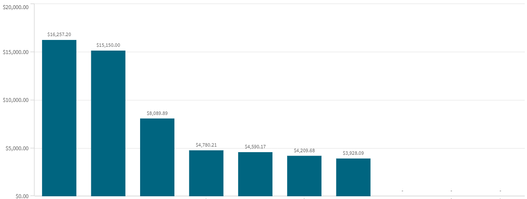
Hi, I have a bar graph that looks like this
You can see that the last three bar are NULL.
I am using this set expression:
MAX({< [Mat] = {"=Rank(MAX([Price]))<=10"} >} IF(ReleasedPrice> 0, [Price]))
I think due to the IF statement at the end, the bar graph displayed like this. I tried to remove the "Include zero values" but the bar graph only shows 7 out of 10 top 10.
There are many prices in my data, so if the item is NULL then the next most expensive item should appear.
The end result must be a bar graph showing the top 10.
Is anyone able to advice how I should make this work? Thanks.
Accepted Solutions
- Mark as New
- Bookmark
- Subscribe
- Mute
- Subscribe to RSS Feed
- Permalink
- Report Inappropriate Content
Remove this expression and in bar chart dimension there is an option to limit data there select top 10 and only those will be displayed, write a simple expression by which you are getting all the items in your bar chart.
Please Accepts as Solution if it solves your query.
- Mark as New
- Bookmark
- Subscribe
- Mute
- Subscribe to RSS Feed
- Permalink
- Report Inappropriate Content
Wow, didn't realised this in Qlik Sense...
Thank you once again Neeraj.
- Mark as New
- Bookmark
- Subscribe
- Mute
- Subscribe to RSS Feed
- Permalink
- Report Inappropriate Content
Hello,
How can we do this if we want to see items 6-10 on a bar graph? I have two graphs and the first shows the top 5 values. I want the second to show the next 5 values after that.
Thanks in advance.

