Unlock a world of possibilities! Login now and discover the exclusive benefits awaiting you.
- Qlik Community
- :
- Forums
- :
- Analytics
- :
- New to Qlik Analytics
- :
- Totals at different levels
- Subscribe to RSS Feed
- Mark Topic as New
- Mark Topic as Read
- Float this Topic for Current User
- Bookmark
- Subscribe
- Mute
- Printer Friendly Page
- Mark as New
- Bookmark
- Subscribe
- Mute
- Subscribe to RSS Feed
- Permalink
- Report Inappropriate Content
Totals at different levels
Hi All,
In my dashboard I have data in the format in a table.
| Firm | Agent ID | Cases Closed | Cases Created | In-Progress Cases |
| A | 1 | 10 | 0 | 0 |
| A | 2 | 20 | 10 | 0 |
| B | 3 | 0 | 10 | 0 |
| B | 4 | 20 | 20 | 0 |
The columns Firm and Agent ID are dimensions while others are measures.
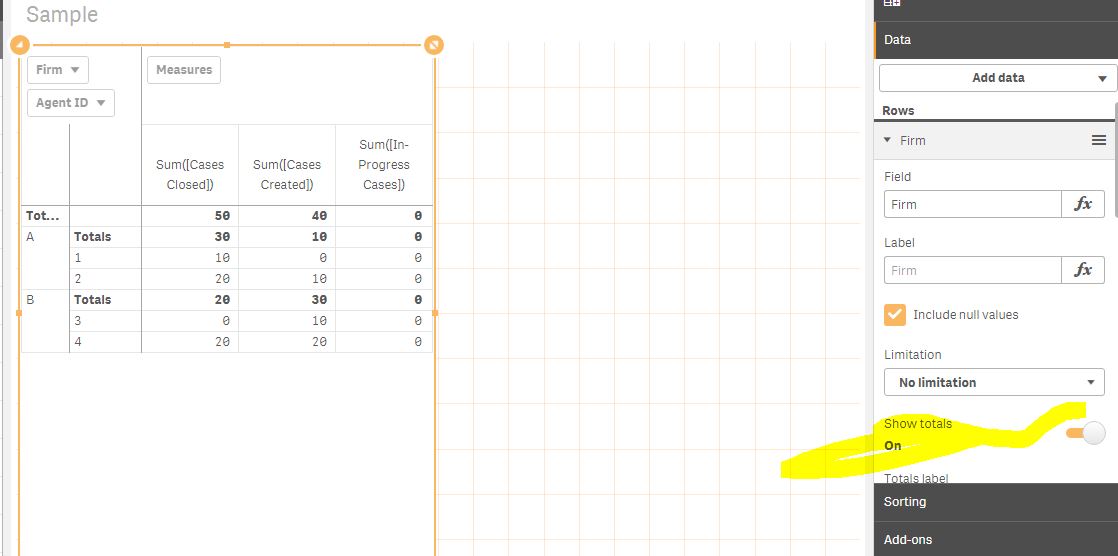
Now I need to show the totals based on both the firm level as well as the total for the whole table. So, the output should appear as below.
| Firm | Agent ID | Cases Closed | Cases Created | In-Progress Cases |
| A | 1 | 10 | 0 | 0 |
| A | 2 | 20 | 10 | 0 |
| Totals | 30 | 10 | 0 | |
| B | 3 | 0 | 10 | 0 |
| B | 4 | 20 | 20 | 0 |
| Totals | 20 | 30 | 0 | |
| Totals | 50 | 40 | 0 |
So, the first Totals in row no. 3 will show the total for firm A, i.e., sum of values for Agent Id 1 and 2. The Totals in row no. 6 will show the total for firm B, i.e., sum of values for Agent Id 3 and 4. And the Totals in row no. 7 will show the sum of values for firm A and B.
Can anyone please tell me how to implement this in qlik sense.
Thanks,
Rajarshi Guin
- Mark as New
- Bookmark
- Subscribe
- Mute
- Subscribe to RSS Feed
- Permalink
- Report Inappropriate Content
Create a pivot table and enable subtotals for Agent ID field
- Mark as New
- Bookmark
- Subscribe
- Mute
- Subscribe to RSS Feed
- Permalink
- Report Inappropriate Content
Sunny's solution is better,
But if you're okay with the table looking slightly different, you can try:
Create 1 measure for Cases Closed and use:
Only(Aggr( Sum([Cases Closed]) , Firm ) )
// -------------- -------------- -------------- --------------
Create 1 more measure for Cases Created and use:
Only(Aggr( Sum([Cases Created]) , Firm ) )
- Mark as New
- Bookmark
- Subscribe
- Mute
- Subscribe to RSS Feed
- Permalink
- Report Inappropriate Content
Hi
Just enable total on the Firm & Agent ID row dimension in a pivot table