Unlock a world of possibilities! Login now and discover the exclusive benefits awaiting you.
- Qlik Community
- :
- Forums
- :
- Analytics
- :
- New to Qlik Analytics
- :
- Trend Lines - AVG(AGGR()) problems in calculations
- Subscribe to RSS Feed
- Mark Topic as New
- Mark Topic as Read
- Float this Topic for Current User
- Bookmark
- Subscribe
- Mute
- Printer Friendly Page
- Mark as New
- Bookmark
- Subscribe
- Mute
- Subscribe to RSS Feed
- Permalink
- Report Inappropriate Content
Trend Lines - AVG(AGGR()) problems in calculations
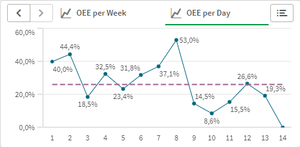
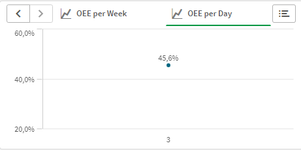
Having problems while calculations Trend Lines per day

Because when you select a specific day, a different value is displayed.

Here's what the formula looks like :
[Avy] *
(sum(aggr((sum({<Plant={'UM'}>}TotalLength) / sum({<Plant={'UM'}>}total <Day> TotalLength)) * avg(aggr((sum({<Plant={'UM'}>}TotalLength) / (sum({<Plant={'UM'}>}PerformanceTime) * 60)) / sum(aggr(only({<Plant={'UM'}>}[Planned speed]), WopID)), WopID)), Day, WopID)))
* [Qty]
=> [Avy] and [QTY] are good parts and they do not cause the problem in selections, I know that.
- Mark as New
- Bookmark
- Subscribe
- Mute
- Subscribe to RSS Feed
- Permalink
- Report Inappropriate Content
Hi @okin_pfa ,
it is very hard to confirm solution without having sample data, but I see that you use total <Day> in one place, but not in other ones. Maybe try to include total <Day> in your partial expressions and you will find solution.
BR
m
- Mark as New
- Bookmark
- Subscribe
- Mute
- Subscribe to RSS Feed
- Permalink
- Report Inappropriate Content
Also having this issue, using a YearMonth dimension against aggregate measures!