Unlock a world of possibilities! Login now and discover the exclusive benefits awaiting you.
- Qlik Community
- :
- Forums
- :
- Analytics
- :
- New to Qlik Analytics
- :
- Trended Inflation Data
- Subscribe to RSS Feed
- Mark Topic as New
- Mark Topic as Read
- Float this Topic for Current User
- Bookmark
- Subscribe
- Mute
- Printer Friendly Page
- Mark as New
- Bookmark
- Subscribe
- Mute
- Subscribe to RSS Feed
- Permalink
- Report Inappropriate Content
Trended Inflation Data
This seems like it should be straight forward, but this is the first time I've used Qliksense so I'm still learning the syntax. I've attached a screen shot of my data. It has four fields:
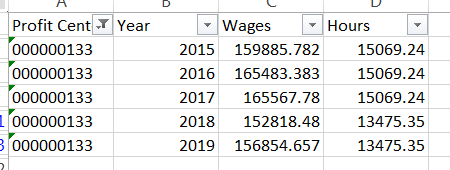
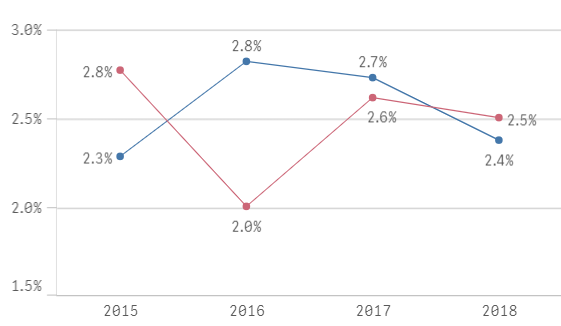
I want to create a graph that shows year of year labor inflation. So for 2016, the value would be:
((Sum(Wages) where Year = 2016)/(Sum(hours) where Year= 2016) -
(Sum(Wages) where Year =2015)/(Sum(Hours) where Year=2015)) /
(Sum(Wages) where Year =2015)/(Sum(Hours) where Year=2015)
2016 would, in theory, be replaced with the Year from the dimension and 2015 would be replaced with Year-1.
The end result would look like this, where I've just loaded the data as final inflation numbers.
Any advice would be appreciated.