Unlock a world of possibilities! Login now and discover the exclusive benefits awaiting you.
- Qlik Community
- :
- Forums
- :
- Analytics
- :
- New to Qlik Analytics
- :
- Use Aggr in Bar Chart without matching Dim
- Subscribe to RSS Feed
- Mark Topic as New
- Mark Topic as Read
- Float this Topic for Current User
- Bookmark
- Subscribe
- Mute
- Printer Friendly Page
- Mark as New
- Bookmark
- Subscribe
- Mute
- Subscribe to RSS Feed
- Permalink
- Report Inappropriate Content
Use Aggr in Bar Chart without matching Dim
Hello Folks,
I'm working on what I thought was a simple problem. Long story short, I don't want to double count values, so I'm using some monstrosity of
SUM(AGGR(SUM(CarFuelAmountGal), CarId))
In a bar chart using a Drilldown dimension of (Year, Month, Week). Of course, this is wrong and I think since the dimension isn't matching up.
Demo Data - Let's assume we have a trip list, with each row containing a Car Id, the fuel in the car and a name of a person in the vehicle.
TripTable:
LOAD *,
DayStart(Date([Trip Date Text])) AS '%trip_cal_key',
Date([Trip Date Text]) AS [Trip Date]
;
LOAD * Inline
[
'CarId', 'CarFuelAmountGal', 'CarTripParticipant', 'Participant Number' ,'Trip Date Text'
    1, 50, 'Jimi Hendrix', 'Driver', 8/13/2018
    1, 50, 'Janis Joplin', 'Passenger', 8/13/2018

    2, 35, 'Eric Clapton', 'Driver',10/12/2017
    2, 35, 'The Beegees', 'Passenger', 08/12/2017

    3, 27, 'Stevie Wonder', 'Driver',05/09/2016
    3, 27, 'Rush', 'Passenger', 05/09/2016
]
;
Now imagine that I want to see the amount of fuel in each car as my measure, with a Calendar drilldown as my dimension. In SQL I would say "SELECT SUM(CarFuelAmountGal) From SomeTable GROUP BY CarId". This isn't quite working in my QlikSense barchart and it's putting the measure wherever it feels like.
I've attached the demo to this post to better show the problem I'm trying to solve.
Any help is greatly appreciated.
Accepted Solutions
- Mark as New
- Bookmark
- Subscribe
- Mute
- Subscribe to RSS Feed
- Permalink
- Report Inappropriate Content
Does this solve your problem?
Sum(Aggr(Sum(DISTINCT CarFuelAmountGal), CarId))

- Mark as New
- Bookmark
- Subscribe
- Mute
- Subscribe to RSS Feed
- Permalink
- Report Inappropriate Content
What is the output you are expecting to see?
- Mark as New
- Bookmark
- Subscribe
- Mute
- Subscribe to RSS Feed
- Permalink
- Report Inappropriate Content
Hello Sunny,
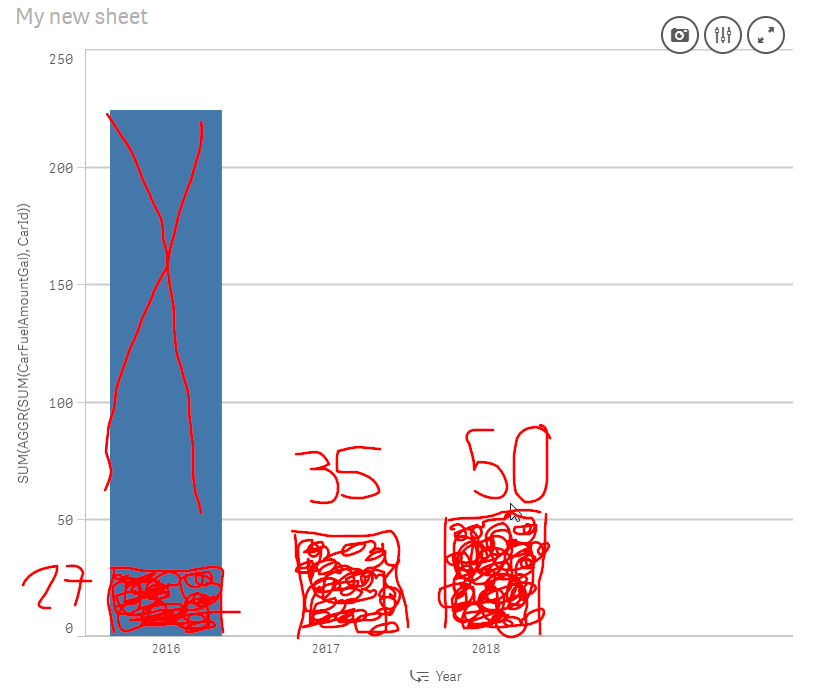
I'm expecting something like this.
- Mark as New
- Bookmark
- Subscribe
- Mute
- Subscribe to RSS Feed
- Permalink
- Report Inappropriate Content
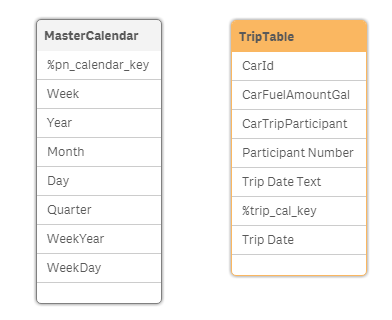
But your MasterCalendar table and TripTable are not connected to each other?
- Mark as New
- Bookmark
- Subscribe
- Mute
- Subscribe to RSS Feed
- Permalink
- Report Inappropriate Content
Hello Sunny,
You are so right, I tried to recreate a sample of the production problem I had and I botched it. I decided to check my script to prevent further wreckage of ones' self. Here is the script that you should be able to copy and paste if you so please. Notice how totals are all messed up when looking at the bar chart.
TripTable:
LOAD *,
DayStart(Date([Trip Date Text])) AS '%trip_cal_key',
Date([Trip Date Text]) AS [Trip Date]
;
LOAD * Inline
[
'CarId', 'CarFuelAmountGal', 'CarTripParticipant', 'Participant Number' ,'Trip Date Text'
    1, 50, 'Jimi Hendrix', 'Driver', 8/13/2018
    1, 50, 'Janis Joplin', 'Passenger', 8/13/2018

    2, 35, 'Eric Clapton', 'Driver',10/12/2017
    2, 35, 'The Beegees', 'Passenger', 10/12/2017

    3, 27, 'Stevie Wonder', 'Driver',05/09/2016
    3, 27, 'Rush', 'Passenger', 05/09/2016
]
;
MasterCalendar:
LEFT KEEP(TripTable)
LOAD
TempDate AS %trip_cal_key,
WEEK(TempDate) As Week,
YEAR(TempDate) As Year,
MONTH(TempDate) As Month,
DAY(TempDate) As Day,
'Q' & CEIL(MONTH(TempDate) / 3) AS Quarter,
WEEK(WEEKSTART(TempDate)) & '-' & WEEKYEAR(TempDate) as WeekYear,
WEEKDAY(TempDate) as WeekDay
;


//=== Generate a temp table of dates ===
LOAD
DATE(mindate + IterNo()) AS TempDate
,maxdate // Used in InYearToDate() above, but not kept
WHILE mindate + IterNo() <= maxdate;


//=== Get min/max dates from Field ===/
LOAD
MIN(FieldValue('%trip_cal_key', recno()))-1 as mindate,
MAX(FieldValue('%trip_cal_key', recno())) as maxdate
AUTOGENERATE FieldValueCount('%trip_cal_key');
EXIT Script
;
- Mark as New
- Bookmark
- Subscribe
- Mute
- Subscribe to RSS Feed
- Permalink
- Report Inappropriate Content
Does this solve your problem?
Sum(Aggr(Sum(DISTINCT CarFuelAmountGal), CarId))
- Mark as New
- Bookmark
- Subscribe
- Mute
- Subscribe to RSS Feed
- Permalink
- Report Inappropriate Content
Yes, that's it. AGGR and me have never gotten along...