Unlock a world of possibilities! Login now and discover the exclusive benefits awaiting you.
- Qlik Community
- :
- Forums
- :
- Analytics
- :
- New to Qlik Analytics
- :
- Using set analysis/filters for dimensions
- Subscribe to RSS Feed
- Mark Topic as New
- Mark Topic as Read
- Float this Topic for Current User
- Bookmark
- Subscribe
- Mute
- Printer Friendly Page
- Mark as New
- Bookmark
- Subscribe
- Mute
- Subscribe to RSS Feed
- Permalink
- Report Inappropriate Content
Using set analysis/filters for dimensions
I have this table:
Col1 Col2
A 12
B 9
C 2
D 5
E 6
F 10
I'm building a bar chart and I need Col1 as the dimension. But I need only values B, C, E, F (say).
How do we use set analysis or filters here?
If we're using filters, the user should not have the freedom to manipulate this selection. At the same time, I need all the values available for other graphs in the sheet.
Thanks in advance!
Accepted Solutions
- Mark as New
- Bookmark
- Subscribe
- Mute
- Subscribe to RSS Feed
- Permalink
- Report Inappropriate Content
- Mark as New
- Bookmark
- Subscribe
- Mute
- Subscribe to RSS Feed
- Permalink
- Report Inappropriate Content
use set analysis in chart expression like below:
ex. sum( {< Col1 = {'B','C','E','F'} >} Col2 )
- Mark as New
- Bookmark
- Subscribe
- Mute
- Subscribe to RSS Feed
- Permalink
- Report Inappropriate Content
May be this
Sum({<Col1 = {'B', 'C', 'E', 'F'}>}Col2)
- Mark as New
- Bookmark
- Subscribe
- Mute
- Subscribe to RSS Feed
- Permalink
- Report Inappropriate Content
Thanks. Can you tell me why this code isn't working. I seem to be missing something really simple here.

- Mark as New
- Bookmark
- Subscribe
- Mute
- Subscribe to RSS Feed
- Permalink
- Report Inappropriate Content
Missing a dollar sign expansion
Sum({<Year = {$(=Min(Year)), $(=Max(Year))}>} [Post Efficiency Savings])
- Mark as New
- Bookmark
- Subscribe
- Mute
- Subscribe to RSS Feed
- Permalink
- Report Inappropriate Content
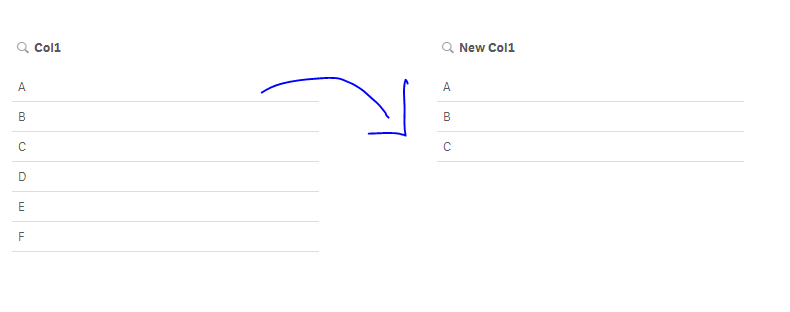
If you want to have a filter that contains only certain values of the col1, you can create a master dimension as follow:
=if( match(Col1,'A','B','C'), Col1,Null())
and then add it as a filter :
- Mark as New
- Bookmark
- Subscribe
- Mute
- Subscribe to RSS Feed
- Permalink
- Report Inappropriate Content
Thanks Omar. Really helpful.
- Mark as New
- Bookmark
- Subscribe
- Mute
- Subscribe to RSS Feed
- Permalink
- Report Inappropriate Content
Thanks a lot Sunny.