Unlock a world of possibilities! Login now and discover the exclusive benefits awaiting you.
- Qlik Community
- :
- Forums
- :
- Analytics
- :
- New to Qlik Analytics
- :
- Re: Variable Creation
- Subscribe to RSS Feed
- Mark Topic as New
- Mark Topic as Read
- Float this Topic for Current User
- Bookmark
- Subscribe
- Mute
- Printer Friendly Page
- Mark as New
- Bookmark
- Subscribe
- Mute
- Subscribe to RSS Feed
- Permalink
- Report Inappropriate Content
Variable Creation
I am trying to create a variable. I would like to take this bar chart and fade from dark to light with a blue color. I work for Michelin so preferably Michelin blue. Any suggestions?

- « Previous Replies
-
- 1
- 2
- Next Replies »
Accepted Solutions
- Mark as New
- Bookmark
- Subscribe
- Mute
- Subscribe to RSS Feed
- Permalink
- Report Inappropriate Content
OK - that was not what I expected but I think I got it:
it seems when using this color by expression that results in a color code when using measures with Set Analysis expressions the sorting does not work, as you stated, thanks for sending the app along so I could see it.
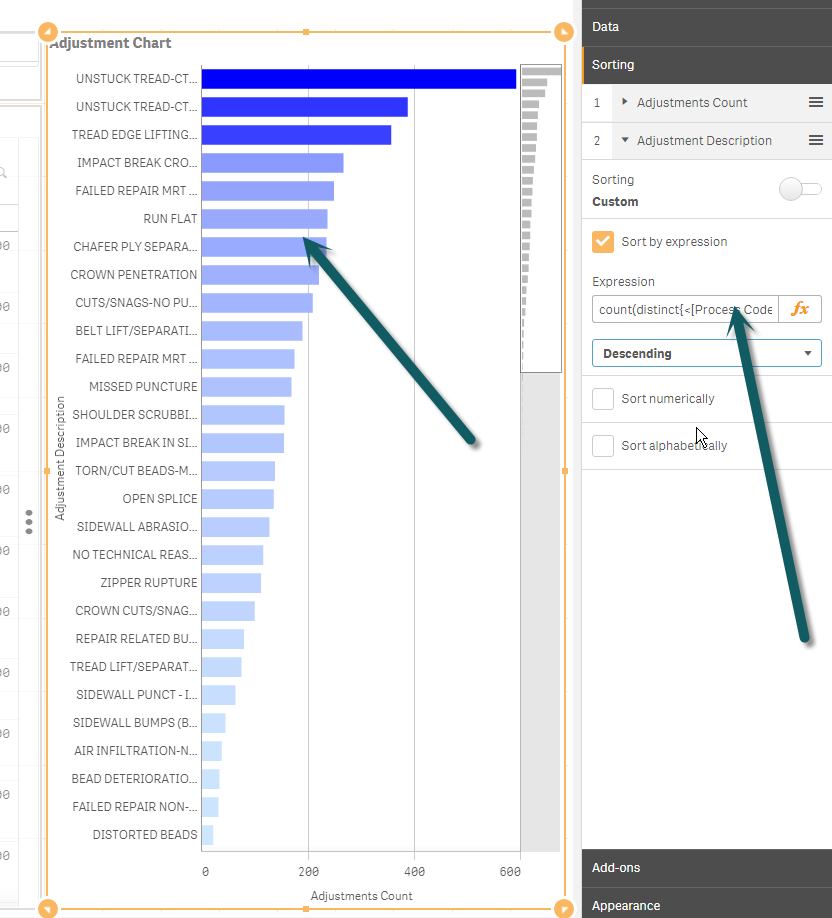
To fix this we use a sort by expression in the Adjustment Description:
I took the count expression: count(distinct{<[Process Code]={'AD'},[Is Completed]={'-1'}>} [Tag #] ) from the Adjustment Count and used it with the Sort by expression option in the Sorting property for the Adjustment Description.
I will find out why this behavior is the way it is, but you should be could now.
When applicable please mark the appropriate replies as CORRECT. This will help community members and Qlik Employees know which discussions have already been addressed and have a possible known solution. Please mark threads as HELPFUL if the provided solution is helpful to the problem, but does not necessarily solve the indicated problem. You can mark multiple threads as HELPFUL if you feel additional info is useful to others.
Regards,
Michael Tarallo (@mtarallo) | Twitter
Qlik
Mike Tarallo
Qlik
- Mark as New
- Bookmark
- Subscribe
- Mute
- Subscribe to RSS Feed
- Permalink
- Report Inappropriate Content
One way is to use the colormix1 function. You can use the Colormix wizard in Qlikview to generate something like this:
ColorMix1 ((1+Sign(2*(sum(Sales)-RangeMin (top(total sum(Sales),1,NoOfRows(total))))/(RangeMax (top(total sum(Sales),1,NoOfRows(total)))-RangeMin (top(total sum(Sales),1,NoOfRows(total))))-1)*Sqrt(Fabs((2*(sum(Sales)-RangeMin (top(total sum(Sales),1,NoOfRows(total))))/(RangeMax (top(total sum(Sales),1,NoOfRows(total)))-RangeMin (top(total sum(Sales),1,NoOfRows(total))))-1))))/2, ARGB(255, 211, 235, 254), ARGB(255, 0, 0, 255))
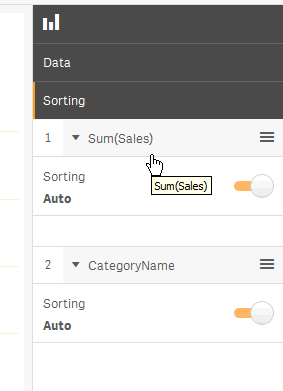
Replace sum(Sales) everywhere with the expression of your measure.
Or you can try the HSL function and tweak it until you like what you see:
HSL(0.6,0.5,0.35 + 0.5*(rank(sum(Sales))/ NoOfRows(total)))
talk is cheap, supply exceeds demand
- Mark as New
- Bookmark
- Subscribe
- Mute
- Subscribe to RSS Feed
- Permalink
- Report Inappropriate Content
I had a similar situation with specific brand colors, that needed to be assigned to particular dimensions. I created color variables loaded from an EXCEL sheet to house these colors and then created my own dimensions and variables for the bar chart.
//Create your Dimensions
=VALUELIST(‘Dimension1’, ‘Dimension2’, ‘Dimension3’, ‘Dimension4’)
//Add your measure
( PICK(
MATCH(
VALUELIST( ‘Dimension1’, ‘Dimension2’, ‘Dimension3’, ‘Dimension4’),
’Dimension1’, ’Dimension2, ’Dimension3’,’Dimension4’
),
NUM(SUM(Dimension1_Value), ‘#,##0’),
NUM(SUM(Dimension2_Value), ‘#,##0’),
NUM(SUM(Dimension3_Value), ‘#,##0’),
NUM(SUM(Dimension4_Value), ‘#,##0’)
)
)
//add Color Expression
( PICK(
MATCH(
VALUELIST( ‘Dimension1’, ‘Dimension2’, ‘Dimension3’, ‘Dimension4’),
’Dimension1’, ’Dimension2, ’Dimension3’,’Dimension4’
),
$(cPrimary_Blue100),
$(cPrimary_Blue75),
$(cPrimary_Blue55),
$(cPrimary_Blue40)
)
)
- Mark as New
- Bookmark
- Subscribe
- Mute
- Subscribe to RSS Feed
- Permalink
- Report Inappropriate Content
Hi Darry -
You would do as Gysbert stated in the chart property under color and legend and choose expression and make sure the check box for expression is a color code is selected. There is a video here in case you want to see it in action: Qlik Sense in 60 - Color by Expression - YouTube
- more videos: New to Qlik Sense Videos
- Qlik Sense in 60 Playlist:Qlik Sense in 60 - YouTube
Let us know how you do.
When applicable please mark the appropriate replies as CORRECT. This will help community members and Qlik Employees know which discussions have already been addressed and have a possible known solution. Please mark threads as HELPFUL if the provided solution is helpful to the problem, but does not necessarily solve the indicated problem. You can mark multiple threads as HELPFUL if you feel additional info is useful to others.
Regards,
Mike Tarallo
Qlik
Mike Tarallo
Qlik
- Mark as New
- Bookmark
- Subscribe
- Mute
- Subscribe to RSS Feed
- Permalink
- Report Inappropriate Content
Thanks everyone for the feedback... Greatly appreciated. I will give these suggestions a shot. Thanks again!!
- Mark as New
- Bookmark
- Subscribe
- Mute
- Subscribe to RSS Feed
- Permalink
- Report Inappropriate Content
OK,
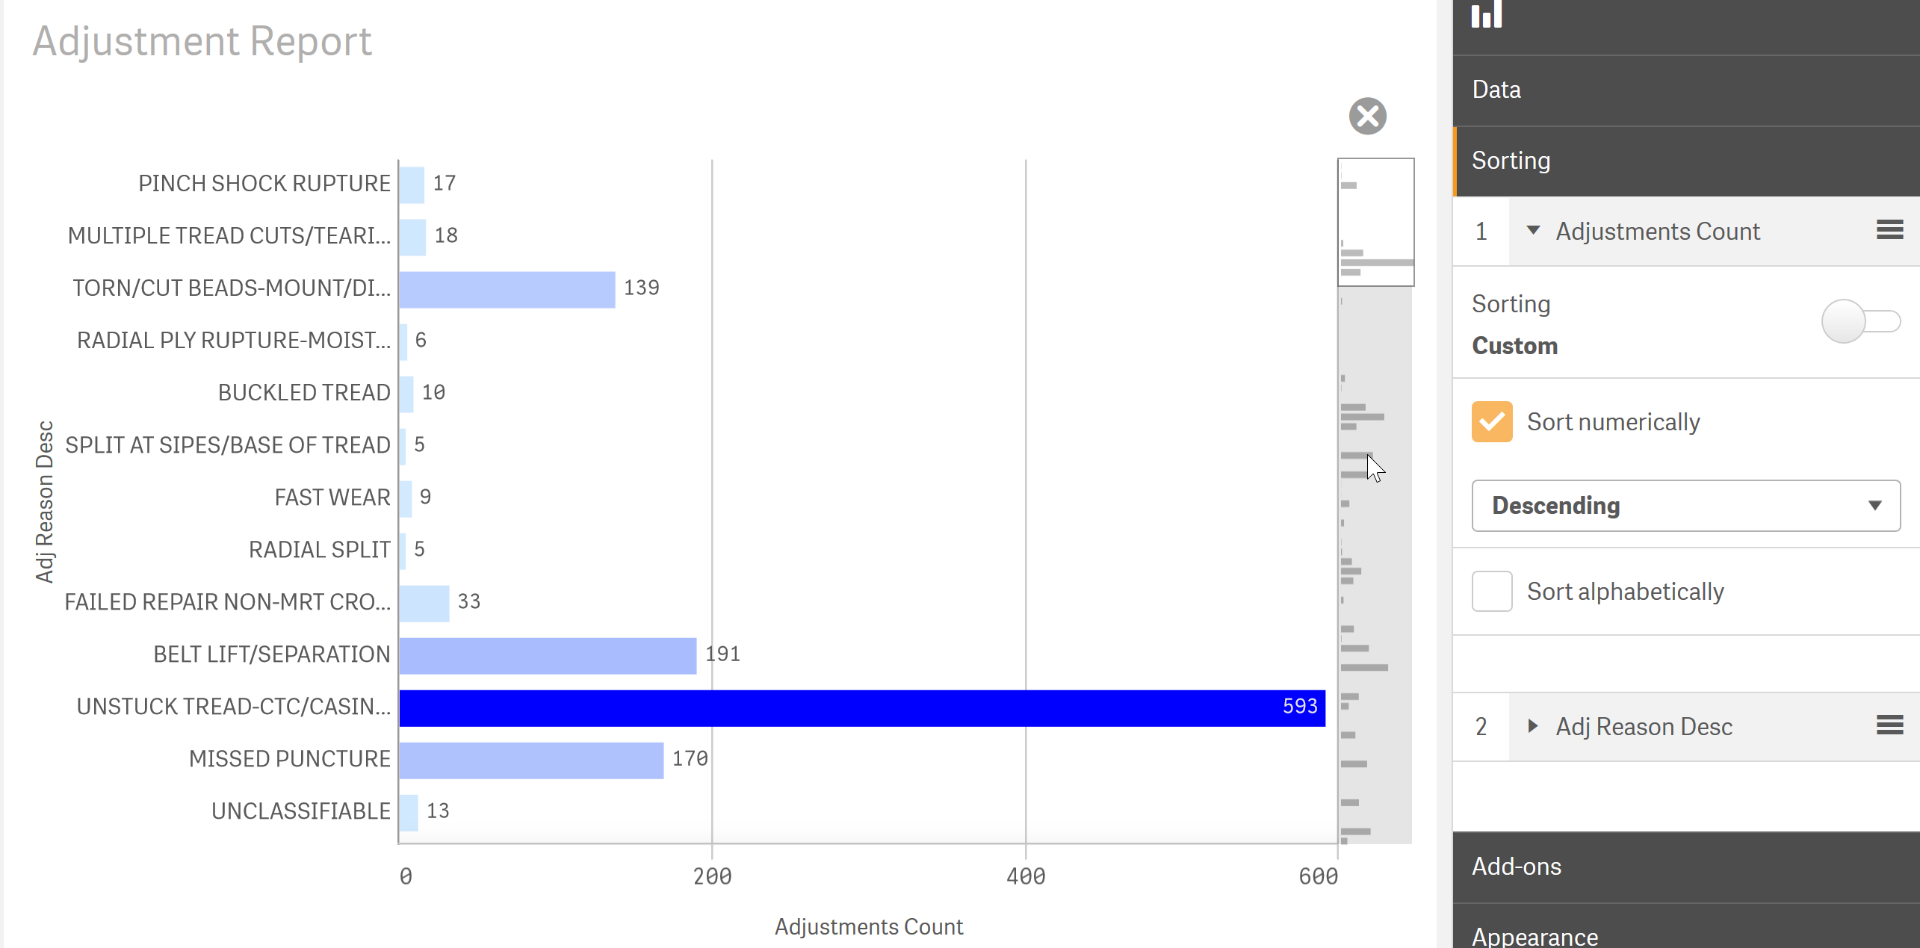
The expression worked perfectly! I substituted sum(sales) with my Adjustment expression. However, after making that change, the sorting changed. Before, I had the chart sorted descending numerically. Is the color mix expression interfering with my sort?
- Mark as New
- Bookmark
- Subscribe
- Mute
- Subscribe to RSS Feed
- Permalink
- Report Inappropriate Content
Hi Darry - that did not happen in my test and not it should not affect the sort order - you should be able to simply change the sort order in the properties pane - let me know how you do.
Mike Tarallo
Qlik
- Mark as New
- Bookmark
- Subscribe
- Mute
- Subscribe to RSS Feed
- Permalink
- Report Inappropriate Content
Michael,
Still does not seem to be working. No matter how I sort, I cannot get it to sort ascending or descending.
- Mark as New
- Bookmark
- Subscribe
- Mute
- Subscribe to RSS Feed
- Permalink
- Report Inappropriate Content
can you attach the .qvf?
Mike Tarallo
Qlik
- Mark as New
- Bookmark
- Subscribe
- Mute
- Subscribe to RSS Feed
- Permalink
- Report Inappropriate Content
Michael,
I am so new at this. My apologies but I am trying to attach the qvf to this thread but do not see how. I can create a new thread and attach. Any assistance would be appreciated.
- « Previous Replies
-
- 1
- 2
- Next Replies »