Unlock a world of possibilities! Login now and discover the exclusive benefits awaiting you.
- Qlik Community
- :
- Forums
- :
- Analytics
- :
- New to Qlik Analytics
- :
- Variable Input by measure
- Subscribe to RSS Feed
- Mark Topic as New
- Mark Topic as Read
- Float this Topic for Current User
- Bookmark
- Subscribe
- Mute
- Printer Friendly Page
- Mark as New
- Bookmark
- Subscribe
- Mute
- Subscribe to RSS Feed
- Permalink
- Report Inappropriate Content
Variable Input by measure
Hello all,
Recently I discovered the "variable input" from the last Qlik bundle. I wanna use it for the end user can manipulate the data in the app and see the effect in a chart.
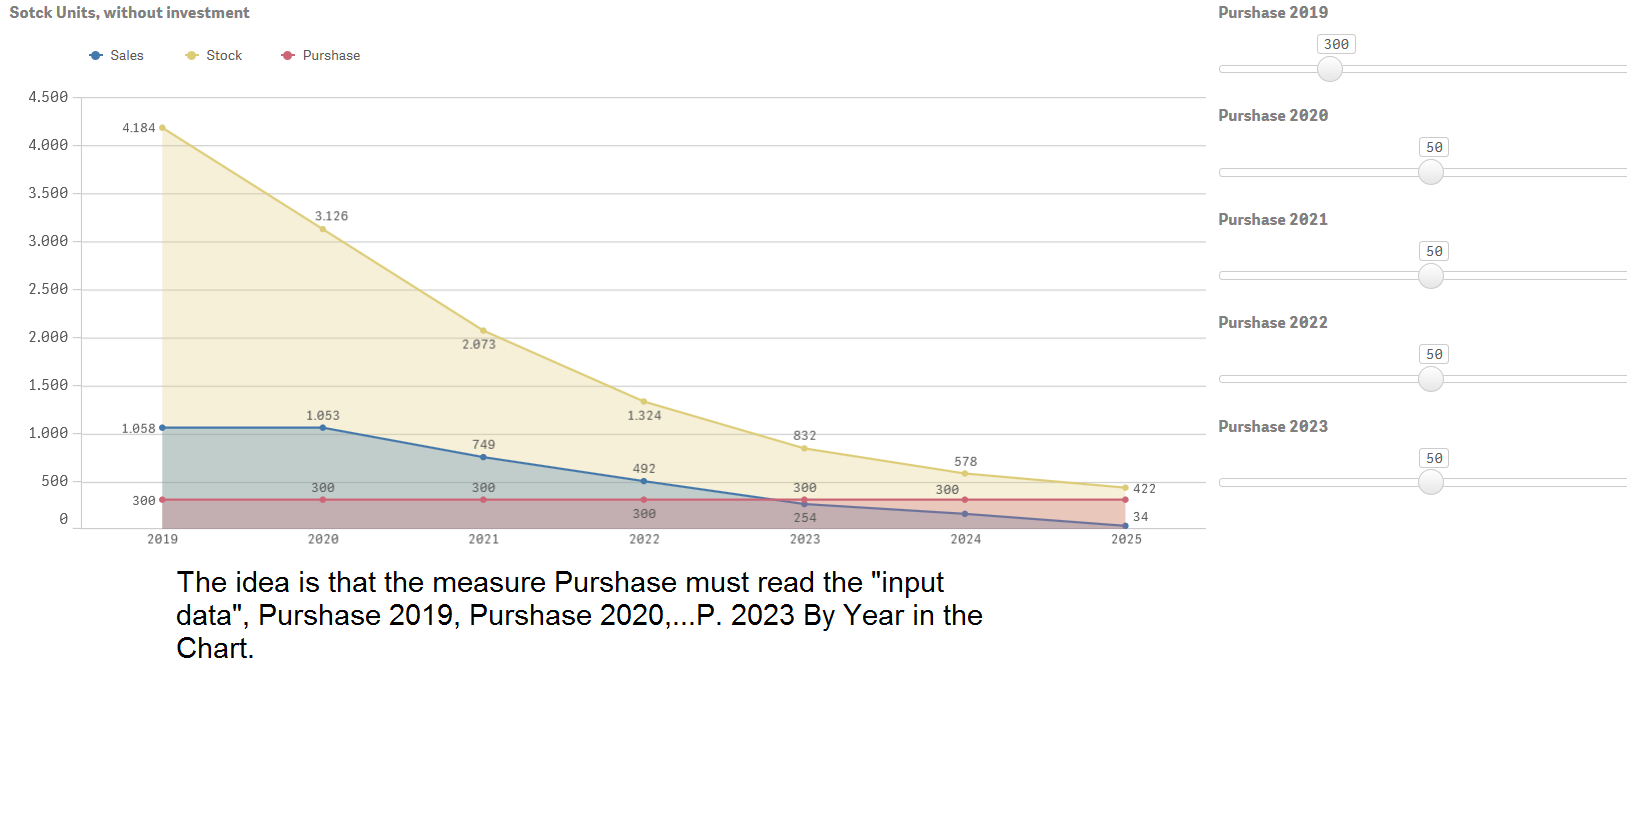
The chart show 2 measures by year, Measure1 is load from a data base, Measure 2 is calculated using "variable inputs" in App (in real time). The idea is put this data in a bar chart:
| Measure1 | Year | |
| 10 | var1 | 2019 |
| 15 | var2 | 2020 |
| 5 | var3 | 2021 |
| 20 | var4 | 2022 |
The expressions in qlik chart are:
-Dimension = Year,
-firts measure is = sum(Measure1)
Second measure: ? ?? I don't know how express one varible by each year.
Can help me please?
Thanks for advance.
- Mark as New
- Bookmark
- Subscribe
- Mute
- Subscribe to RSS Feed
- Permalink
- Report Inappropriate Content
Hi there
What would you like to control using your second variable? And what values will you give it using the Variable Input extension?
Regards,
Mauritz
- Mark as New
- Bookmark
- Subscribe
- Mute
- Subscribe to RSS Feed
- Permalink
- Report Inappropriate Content
Hi Mauritz,
The second measure is: Stock value (read from database) + variable value (read from variable input ). The attached image maybe explain bette the idea.
Regards
Jorge
- Mark as New
- Bookmark
- Subscribe
- Mute
- Subscribe to RSS Feed
- Permalink
- Report Inappropriate Content
Hi Jorge
I think I understand what you want to do. You can either add it as an inline table in the load script and concatenate it on your Year field or use a config file (instead of an inline table). I am on my phone now, but you can have two columns in this inline table, first column called Year (values 2019, 2020, 2021, 2022) and second column called Variables (values var1, var2, var3, var4).
For your second measure you can then use something like =[Stock Price] + $([Variables])
You might need to put $([Variables]) in single quotes (I'm not close to my PC now so I can't test). Then you just create variables var1, var2, var3 and var4 and you can give them values using the variable extension.
I hope this helps.
Regards,
Mauritz