Unlock a world of possibilities! Login now and discover the exclusive benefits awaiting you.
- Qlik Community
- :
- Forums
- :
- Analytics
- :
- New to Qlik Analytics
- :
- Re: Variation of Line Chart
- Subscribe to RSS Feed
- Mark Topic as New
- Mark Topic as Read
- Float this Topic for Current User
- Bookmark
- Subscribe
- Mute
- Printer Friendly Page
- Mark as New
- Bookmark
- Subscribe
- Mute
- Subscribe to RSS Feed
- Permalink
- Report Inappropriate Content
Variation of Line Chart
Hi,
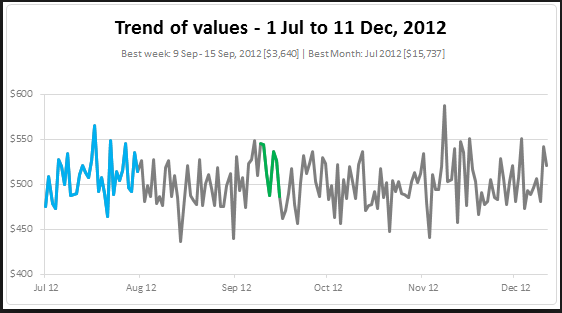
I would like to create a variation of Line chart in Qliksense where in the X: Axis labels in Year and the the value points on Y:axis will be 12 per year even though month is not added as a Dimension , just like how the attached image looks.
Can this be done on Qliksense, if Yes how?
Accepted Solutions
- Mark as New
- Bookmark
- Subscribe
- Mute
- Subscribe to RSS Feed
- Permalink
- Report Inappropriate Content
Hi,
Yes you can do this in Qlik Sense.
All you have to do is add the Date as dimension field in line chart and in Axis Tab in Properties and enable the "Continuous" button.
For more understanding check this video.
https://www.youtube.com/watch?v=gnQtWWpwoq8
Regards,
Kaushik Solanki
- Mark as New
- Bookmark
- Subscribe
- Mute
- Subscribe to RSS Feed
- Permalink
- Report Inappropriate Content
Any thoughts on this thread?
@sunny_talwar @Gysbert_Wassenaar @tresesco @Michael_Tarallo @rwunderlich @Vegar @swuehl @kaushiknsolanki @jonathandienst
- Mark as New
- Bookmark
- Subscribe
- Mute
- Subscribe to RSS Feed
- Permalink
- Report Inappropriate Content
Hi,
Yes you can do this in Qlik Sense.
All you have to do is add the Date as dimension field in line chart and in Axis Tab in Properties and enable the "Continuous" button.
For more understanding check this video.
https://www.youtube.com/watch?v=gnQtWWpwoq8
Regards,
Kaushik Solanki
- Mark as New
- Bookmark
- Subscribe
- Mute
- Subscribe to RSS Feed
- Permalink
- Report Inappropriate Content
Thank you so much Kaushik.