Unlock a world of possibilities! Login now and discover the exclusive benefits awaiting you.
- Qlik Community
- :
- Forums
- :
- Analytics
- :
- New to Qlik Analytics
- :
- Visualization issue - Line Chart
- Subscribe to RSS Feed
- Mark Topic as New
- Mark Topic as Read
- Float this Topic for Current User
- Bookmark
- Subscribe
- Mute
- Printer Friendly Page
- Mark as New
- Bookmark
- Subscribe
- Mute
- Subscribe to RSS Feed
- Permalink
- Report Inappropriate Content
Visualization issue - Line Chart
Hi all,
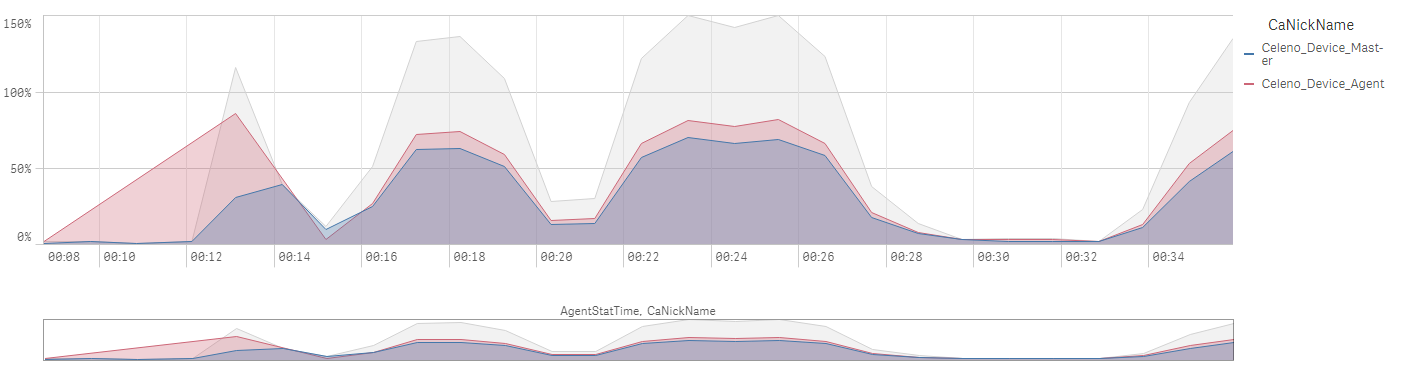
Attached screenshot of a line chart of dimension with two values (2 lines - blue and red) and for some reason I get third gray line that does not appear in my database.
i tried to get rid of it but so far without success. any suggests?
Thanks in advance
- Tags:
- colour line chart
- « Previous Replies
-
- 1
- 2
- Next Replies »
- Mark as New
- Bookmark
- Subscribe
- Mute
- Subscribe to RSS Feed
- Permalink
- Report Inappropriate Content
Actually, I just found a workaround.
Switch off continuous mode on the X-axis property in presentation. Go to data section and uncheck the null value option. Then turn continuous mode back on and the line should be gone.
Definitively a visual bug where the option should not be removed.
Regards,
Patrik.
- Mark as New
- Bookmark
- Subscribe
- Mute
- Subscribe to RSS Feed
- Permalink
- Report Inappropriate Content
Great! works like a charm! Thanks a lot.
- Mark as New
- Bookmark
- Subscribe
- Mute
- Subscribe to RSS Feed
- Permalink
- Report Inappropriate Content
Hi Aviad,
we can able to see include null values option in both dimensions find the screen short.
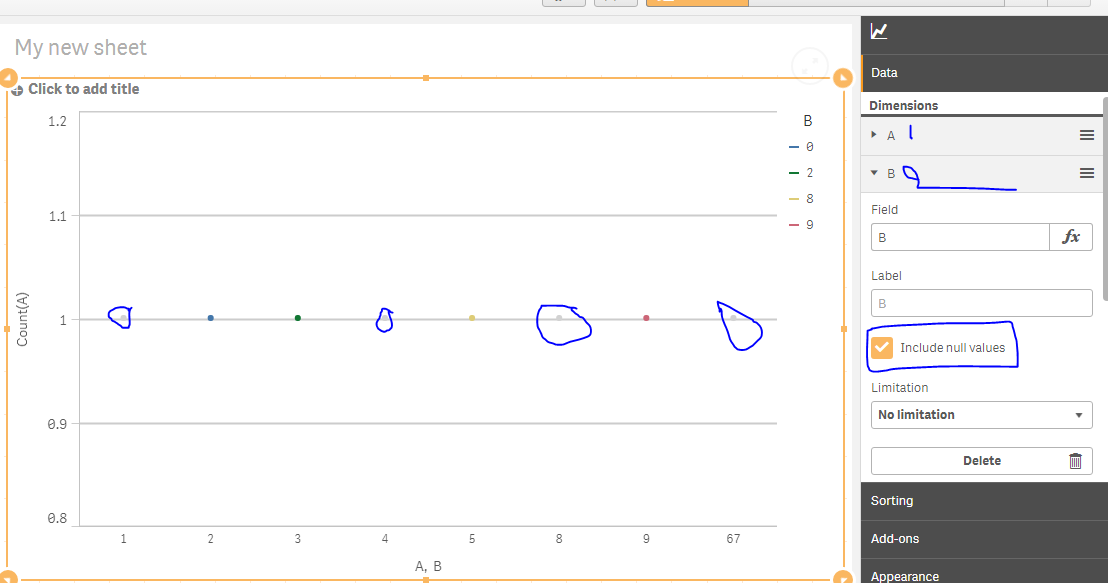
above blue pen rounded place is null values.
Regards
Sathish
- Mark as New
- Bookmark
- Subscribe
- Mute
- Subscribe to RSS Feed
- Permalink
- Report Inappropriate Content
Hi s s,
Thanks for your replies, check Patrik's response above about the missing "Include null values" checkbox.
- « Previous Replies
-
- 1
- 2
- Next Replies »