Unlock a world of possibilities! Login now and discover the exclusive benefits awaiting you.
- Qlik Community
- :
- Forums
- :
- Analytics
- :
- New to Qlik Analytics
- :
- Re: Waterfall Chart with negative values
Options
- Subscribe to RSS Feed
- Mark Topic as New
- Mark Topic as Read
- Float this Topic for Current User
- Bookmark
- Subscribe
- Mute
- Printer Friendly Page
Turn on suggestions
Auto-suggest helps you quickly narrow down your search results by suggesting possible matches as you type.
Showing results for
Creator II
2018-09-18
03:25 AM
- Mark as New
- Bookmark
- Subscribe
- Mute
- Subscribe to RSS Feed
- Permalink
- Report Inappropriate Content
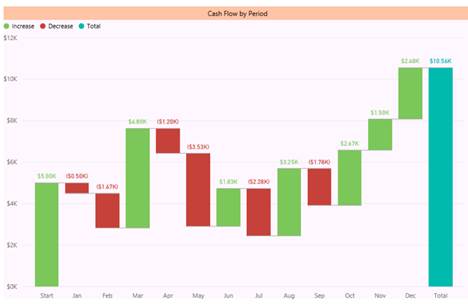
Waterfall Chart with negative values
Is there any way to develop a chart like shown below?
- Dimension – Year Month
- Measure – No of alerts generated by iComfort Devices.
- Coloring – Alerts generated by Current Month > Previous Month -> Green – Alerts generated by Current Month < Previous Month -> Red
- Tags:
- waterfall_chart
972 Views
2 Replies
Luminary
2018-09-18
03:46 AM
- Mark as New
- Bookmark
- Subscribe
- Mute
- Subscribe to RSS Feed
- Permalink
- Report Inappropriate Content
Hi! As the waterfall chart supports only measures, I guess you will have to create a measure for each month and assign custom colors, e.g. something like
January:
Measure: SUM({<Month={'January'}>}Alerts)
Custom color: GREEN()
February:
Measure: SUM({<Month={'February'}>}Alerts) - SUM({<Month={'January'}>}Alerts) to see if there is an increase or decrease
Custom color: IF(SUM({<Month={'February'}>}Alerts) - SUM({<Month={'January'}>}Alerts) > 0, GREEN(), RED())
March:
You got the drill.
vizmind.eu
912 Views
Luminary
2018-09-20
03:45 AM
- Mark as New
- Bookmark
- Subscribe
- Mute
- Subscribe to RSS Feed
- Permalink
- Report Inappropriate Content
So does this work for you?
vizmind.eu
912 Views
Community Browser