Unlock a world of possibilities! Login now and discover the exclusive benefits awaiting you.
- Qlik Community
- :
- Forums
- :
- Analytics
- :
- New to Qlik Analytics
- :
- Week over week comparison in a line graph
- Subscribe to RSS Feed
- Mark Topic as New
- Mark Topic as Read
- Float this Topic for Current User
- Bookmark
- Subscribe
- Mute
- Printer Friendly Page
- Mark as New
- Bookmark
- Subscribe
- Mute
- Subscribe to RSS Feed
- Permalink
- Report Inappropriate Content
Week over week comparison in a line graph
Hi experts,
I am trying to display the following:
A line chart with weeknumbers as the dimension. In the graph I want to display sum of sales, but the values should be the comparison of the week to the week before. For example, the sum of sales value for week 7 should be the sum of sales for week 7 compared to the sum of sales for week 6. Week 8 would display the comparison between week 8 and week 7 etcetera. I have Dates/Weeknumbers but I can't get the measure to work. It either displays the the same value as the actual week or just plain 0.
I've been trying set analysis and using AGGR but no succes so far. Any ideas?
Thanks!
Stijn
Accepted Solutions
- Mark as New
- Bookmark
- Subscribe
- Mute
- Subscribe to RSS Feed
- Permalink
- Report Inappropriate Content
- Mark as New
- Bookmark
- Subscribe
- Mute
- Subscribe to RSS Feed
- Permalink
- Report Inappropriate Content
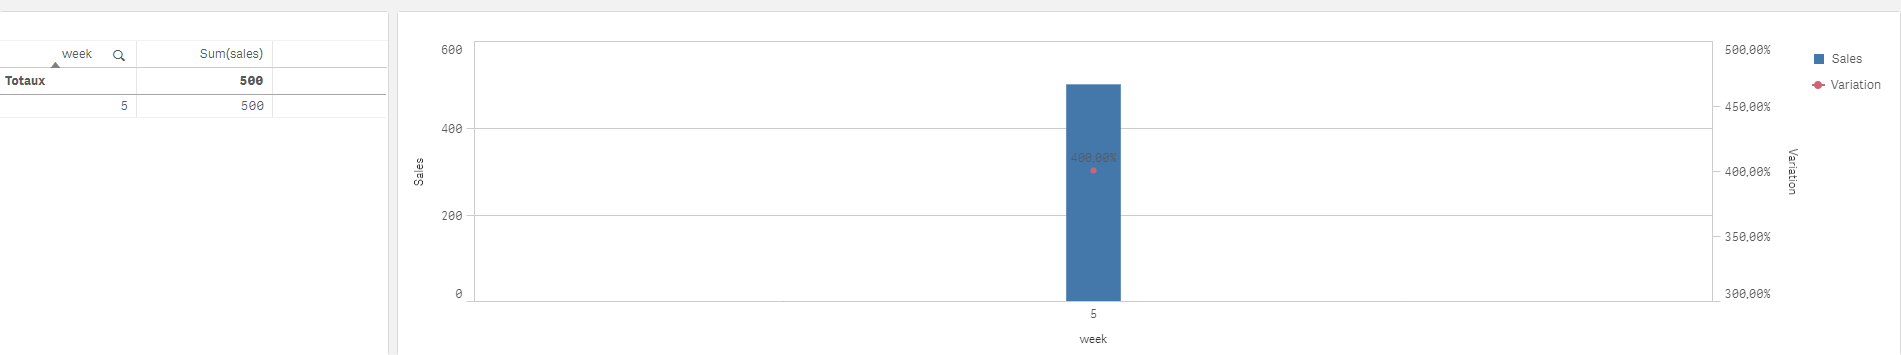
try :
(Sum(sales)-above(sum(sales)))/above(sum(sales))
Result:
- Mark as New
- Bookmark
- Subscribe
- Mute
- Subscribe to RSS Feed
- Permalink
- Report Inappropriate Content
It works! Thanks!
- Mark as New
- Bookmark
- Subscribe
- Mute
- Subscribe to RSS Feed
- Permalink
- Report Inappropriate Content
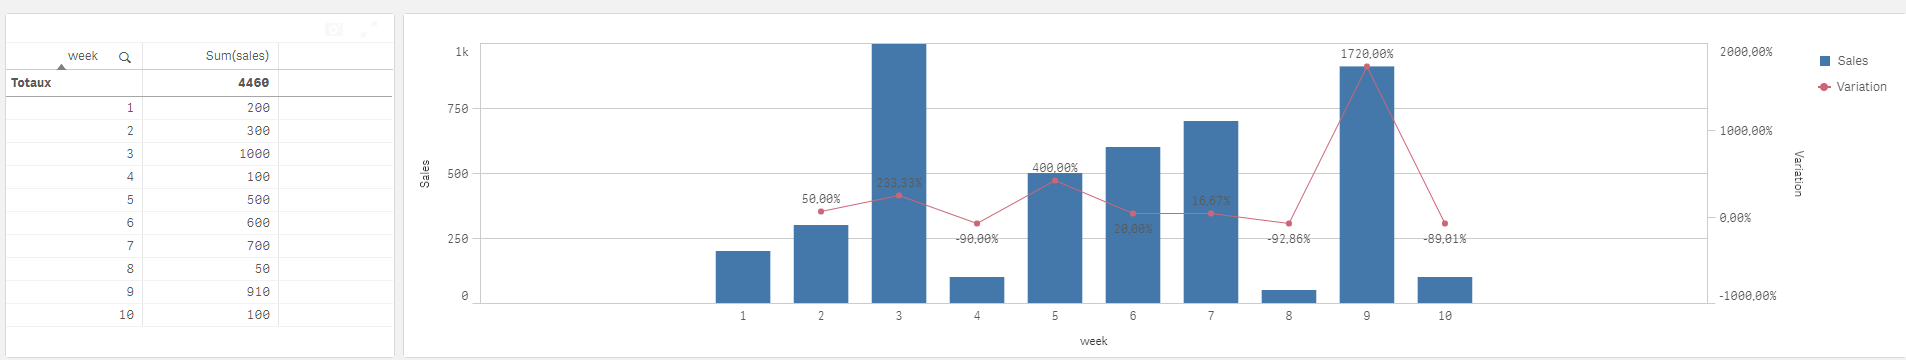
With the current expression, if u select a week you won't get a good result; if u want the result to be good if u select a week, please do as follow:
sum({<week=p(week)>}aggr((Sum({<week>}sales)-above(sum({<week>}sales)))/above(sum({<week>}sales)),week))
Result: