Unlock a world of possibilities! Login now and discover the exclusive benefits awaiting you.
- Qlik Community
- :
- Forums
- :
- Analytics
- :
- New to Qlik Analytics
- :
- Weekly snapshot to Monthly report
- Subscribe to RSS Feed
- Mark Topic as New
- Mark Topic as Read
- Float this Topic for Current User
- Bookmark
- Subscribe
- Mute
- Printer Friendly Page
- Mark as New
- Bookmark
- Subscribe
- Mute
- Subscribe to RSS Feed
- Permalink
- Report Inappropriate Content
Weekly snapshot to Monthly report
I have weekly snapshot and have to show as month wise, while converting into month it is showing as 2 same months with different count. I need to show the only first row for the month of september and the rest of 2 should not be shown. Is there any solution?
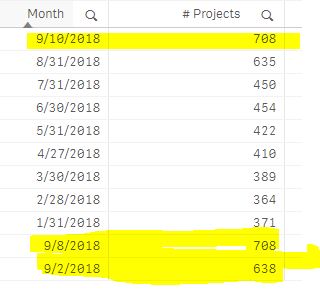
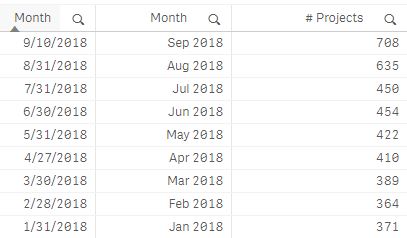
Output should be like below
- Mark as New
- Bookmark
- Subscribe
- Mute
- Subscribe to RSS Feed
- Permalink
- Report Inappropriate Content
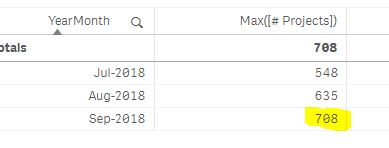
- Create dimension YearMonth in your load script
- Create table object:
- Dimension = YearMonth
- Measure = Max([# Projects])
Sample script
LOAD
     *,
     Dual(Month(Day) & '-' & Year(Day), MonthEnd(Day)) as YearMonth;
LOAD
     Date(Date#(Day,'M/D/YYYY'),'M/D/YYYY') as Day,
     [# Projects];
LOAD * INLINE
[
Day, # Projects
9/10/2018, 708
8/31/2018, 635
9/8/2018, 708
9/2/2018, 638
];
- Mark as New
- Bookmark
- Subscribe
- Mute
- Subscribe to RSS Feed
- Permalink
- Report Inappropriate Content
Forgot to mention one thing is that 9/10/2018 is today's snapshot, If I include 9/11/2018 as 701, it is not working
LOAD * INLINE
[
Day, # Projects
9/11/2018, 701
8/31/2018, 635
7/30/2018, 548
9/8/2018, 708
9/2/2018, 638
];
Still showing 708 for Sep month. It should be 701
- Mark as New
- Bookmark
- Subscribe
- Mute
- Subscribe to RSS Feed
- Permalink
- Report Inappropriate Content
Why dont you create a mapping table to mark the day represents for a month, like
MapFlag:
Mapping Load * INLINE [
Day, Flag
9/11/2018, 1
8/31/2018, 1
7/30/2018, 1 ];


A:
LOAD
     *,
     MonthName(Day) as YearMonth;
LOAD
     Date(Date#(Day,'M/D/YYYY')) as Day,
     ApplyMap('MapFlag',Day,0) As Flag,
     [# Projects];
LOAD * INLINE
[
Day, # Projects
9/11/2018, 701
8/31/2018, 635
7/30/2018, 548
9/8/2018, 708
9/2/2018, 638
];
Then just update your measure to : Sum({<Flag={1}>}[# Projects])
You can create your Mapping table manually or automatically based on your business logic.
- Mark as New
- Bookmark
- Subscribe
- Mute
- Subscribe to RSS Feed
- Permalink
- Report Inappropriate Content
Your aim is to get [# Projects] at the latest day of each YearMonth, so your table object should contain the followings:
- Dimension = YearMonth
- Measure = FirstSortedValue([# Projects],-Day)