Unlock a world of possibilities! Login now and discover the exclusive benefits awaiting you.
- Qlik Community
- :
- Forums
- :
- Analytics
- :
- New to Qlik Analytics
- :
- What does this icon mean in a chart?
- Subscribe to RSS Feed
- Mark Topic as New
- Mark Topic as Read
- Float this Topic for Current User
- Bookmark
- Subscribe
- Mute
- Printer Friendly Page
- Mark as New
- Bookmark
- Subscribe
- Mute
- Subscribe to RSS Feed
- Permalink
- Report Inappropriate Content
What does this icon mean in a chart?
Hi all,
Can anyone please tell me what the red circled "1" means in that chart below?
It doesn't seem to do anything as it is not clickable or anything.
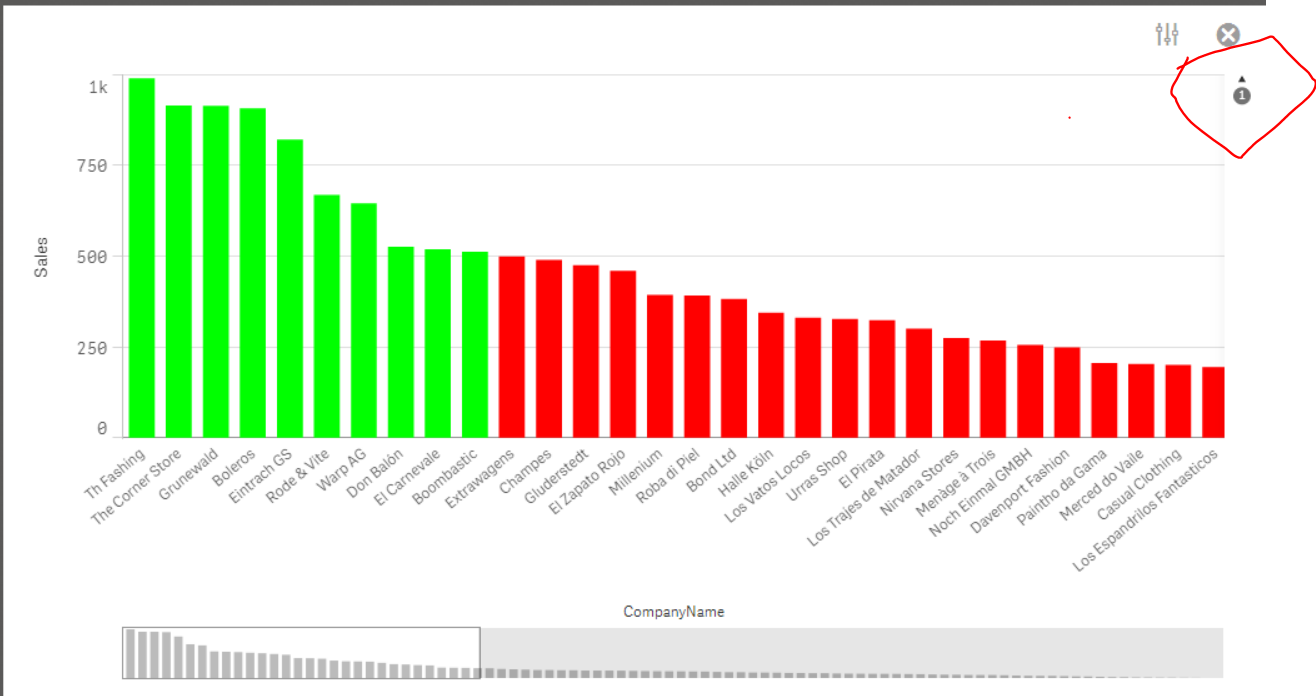
(Click to see full chart)
- Mark as New
- Bookmark
- Subscribe
- Mute
- Subscribe to RSS Feed
- Permalink
- Report Inappropriate Content
Can you attach the qvf file?
at first I though it is a link sheet Icon but it is a number, so not sure unless we actually check it.
Thanks.
- Mark as New
- Bookmark
- Subscribe
- Mute
- Subscribe to RSS Feed
- Permalink
- Report Inappropriate Content
Hello John,
What version of Qlik Sense are you using?
I am using 3.0 and I am not seeing this in my chart - I recall that being used to indicate more information. Let me ask around.
Please mark the appropriate replies as CORRECT / HELPFUL so our team and other members know that your question(s) has been answered to your satisfaction.
Regards,
Mike Tarallo
Qlik
Mike Tarallo
Qlik
- Mark as New
- Bookmark
- Subscribe
- Mute
- Subscribe to RSS Feed
- Permalink
- Report Inappropriate Content
Hi John,
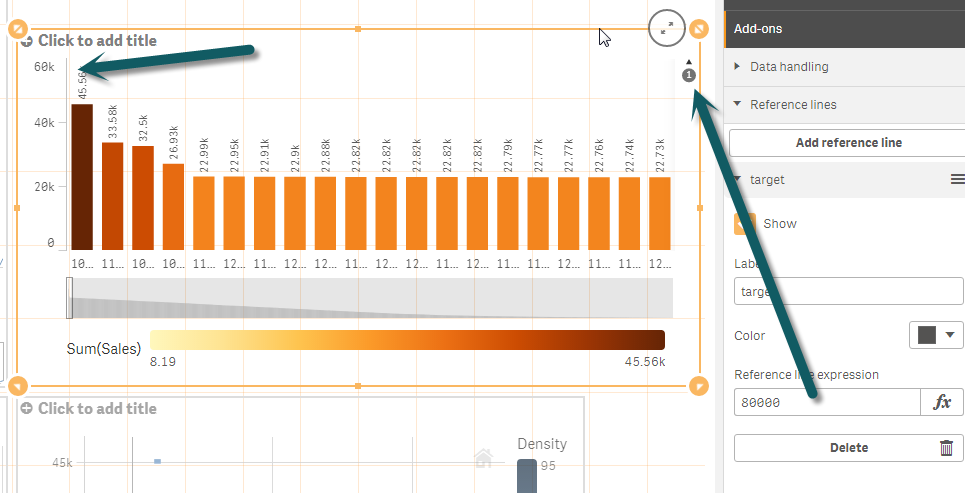
I took it one step further - it means there is a reference line outside of the current measure area - see screen shots in both edit and analysis mode:
Edit more: note the 1 - and the top value is 60K while the reference line is 80K
(click to enlarge)
Analysis mode:
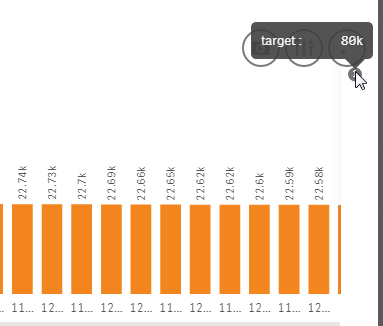
HTH
Please mark the appropriate replies as CORRECT so our team and other members know that your question(s) has been answered to your satisfaction.
Regards,
Mike Tarallo
Qlik
Mike Tarallo
Qlik