Unlock a world of possibilities! Login now and discover the exclusive benefits awaiting you.
- Qlik Community
- :
- Forums
- :
- Analytics
- :
- New to Qlik Analytics
- :
- Re: When I create a line chart, a second mini vers...
- Subscribe to RSS Feed
- Mark Topic as New
- Mark Topic as Read
- Float this Topic for Current User
- Bookmark
- Subscribe
- Mute
- Printer Friendly Page
- Mark as New
- Bookmark
- Subscribe
- Mute
- Subscribe to RSS Feed
- Permalink
- Report Inappropriate Content
When I create a line chart, a second mini version of the line chart appears below my chart. What is the purpose of this and how can I get rid of it?
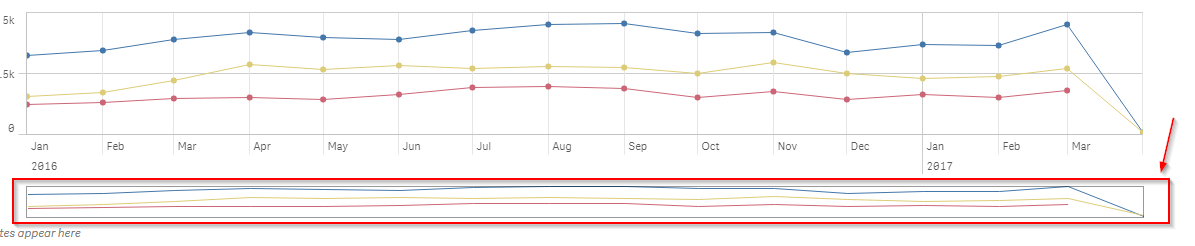
I do not understand why the portion in the red box appears with every line chart. What is the purpose of a very small hard to read line chart appearing below the actual line chart? Is it possible to simply turn off this feature?
Thanks
Accepted Solutions
- Mark as New
- Bookmark
- Subscribe
- Mute
- Subscribe to RSS Feed
- Permalink
- Report Inappropriate Content
Try to make your chart smaller; with the help of that portion, you can navigate left and right.
- Mark as New
- Bookmark
- Subscribe
- Mute
- Subscribe to RSS Feed
- Permalink
- Report Inappropriate Content
Try to make your chart smaller; with the help of that portion, you can navigate left and right.
- Mark as New
- Bookmark
- Subscribe
- Mute
- Subscribe to RSS Feed
- Permalink
- Report Inappropriate Content
That is a scroll bar for the chart. The chart is bigger than can be displayed. So you use that to scroll back and forth through the entire chart.
- Mark as New
- Bookmark
- Subscribe
- Mute
- Subscribe to RSS Feed
- Permalink
- Report Inappropriate Content
It will disappear if your chart is big enough to fit on the screen.
- Mark as New
- Bookmark
- Subscribe
- Mute
- Subscribe to RSS Feed
- Permalink
- Report Inappropriate Content
Thanks all, I can see all my data there in that screenshot so I will play around with the sizing.
- Mark as New
- Bookmark
- Subscribe
- Mute
- Subscribe to RSS Feed
- Permalink
- Report Inappropriate Content
The smaller line chart doesnt seem to be the exact duplicate of the bigger chart, is that a smoothen moving average to help us identify the trend?