Unlock a world of possibilities! Login now and discover the exclusive benefits awaiting you.
- Qlik Community
- :
- Forums
- :
- Analytics
- :
- New to Qlik Analytics
- :
- Why do dimensions are created in that specific way...
- Subscribe to RSS Feed
- Mark Topic as New
- Mark Topic as Read
- Float this Topic for Current User
- Bookmark
- Subscribe
- Mute
- Printer Friendly Page
- Mark as New
- Bookmark
- Subscribe
- Mute
- Subscribe to RSS Feed
- Permalink
- Report Inappropriate Content
Why do dimensions are created in that specific way?
Hi,
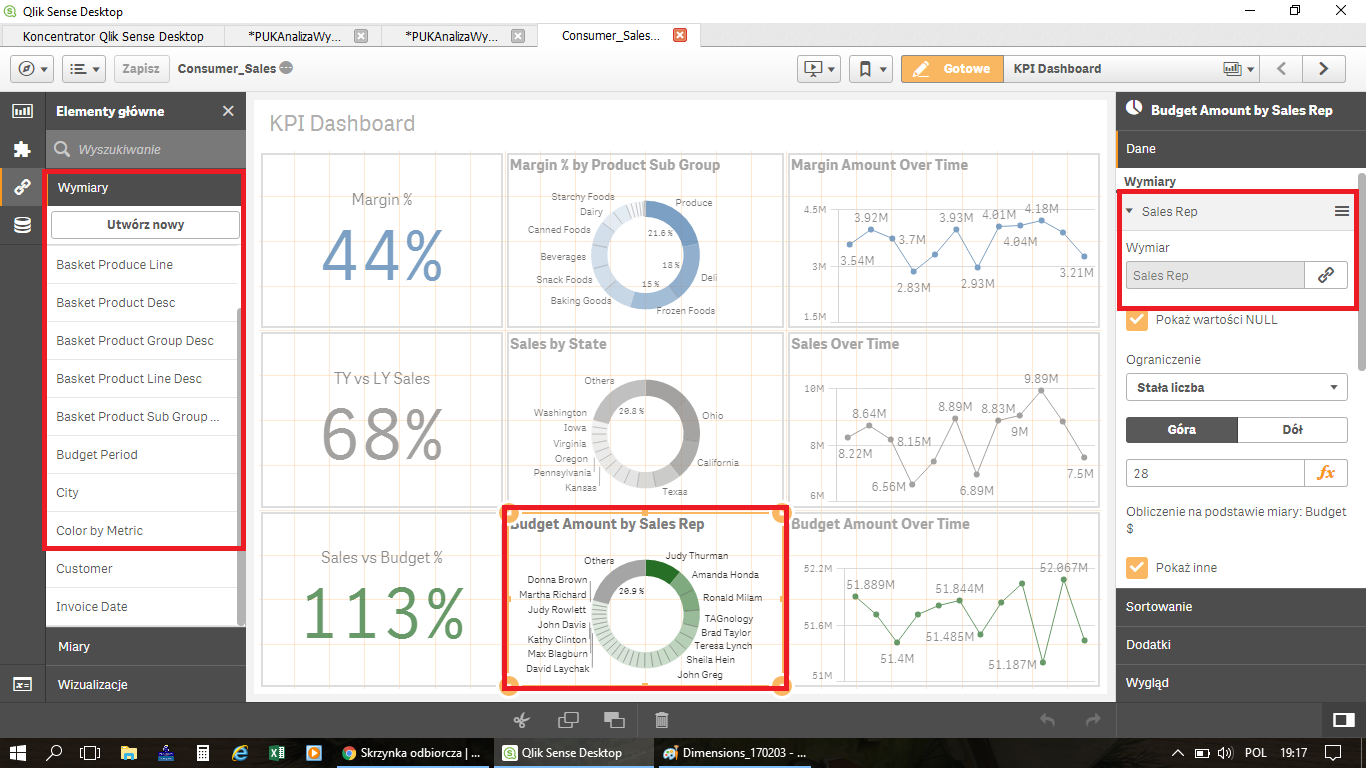
I would like to ask why does the author of this sample application created dimensions in the way that they are on the list on the right side of the window. How they are connected then to the charts so they are as a gray field (on the right side in dimensions from the chart) and disabled to edit. What is the reason that someone decided to do this like that and not just pick the dimension from a table? They are sometimes nested with drill down, what does it mean?
Thank you for some insight into the subject.
M.
- Tags:
- dimensions
Accepted Solutions
- Mark as New
- Bookmark
- Subscribe
- Mute
- Subscribe to RSS Feed
- Permalink
- Report Inappropriate Content
They are Master Items, here is the link to manual bit about them https://help.qlik.com/en-US/sense/3.1/Subsystems/Hub/Content/Dimensions/create-master-dimension.htm
They are, I think, the only way one can create Drill Down Groups and as such are very useful and I use them a fair bit like that.
I quote from the manual link :
When you create and build your visualizations you will come to the point when you realize you have items worth saving to reuse in other visualizations and on other sheets, for your own sake as well as for others using your app. You can save visualizations, dimensions and measures, as master items in the assets panel. When your app gets published these master items will be available to others as ready-to-use visualizations, dimensions and measures.
Master items are very useful, you can use, for example, a master dimension in as many of your visualizations as you like and maintain it in just one place. Any updates you make to the master item will be applied everywhere the master item is used.
One of the purposes with creating and maintaining master items is for other users to explore their own ways and directions in the data, on top of what you have provided in the app as pre-made sheets with visualizations. The users will be able to create their own visualizations with your pre-made master dimensions and master measures, for example.
- Mark as New
- Bookmark
- Subscribe
- Mute
- Subscribe to RSS Feed
- Permalink
- Report Inappropriate Content
Master Items comes handy for Ad-Hoc or Self service reporting for users.
Ex:
A developer adds Dimension and Measures to Master Item and users can just drag and drop these Dim or measures and use to create their own charts or tables.
You can add whole chart as Master Visualization, just drag and drop it if you using the chart again and again. Same thing with Master Dim & Measures. You can create repeating Measures or Dim, save as Master, later use it in future in different charts.
Thanks.
- Mark as New
- Bookmark
- Subscribe
- Mute
- Subscribe to RSS Feed
- Permalink
- Report Inappropriate Content
Now I see I should use it instead of creating formulas as variables. It's more practical.
Thanks.
M.
- Mark as New
- Bookmark
- Subscribe
- Mute
- Subscribe to RSS Feed
- Permalink
- Report Inappropriate Content
Thank you, for your explanation Bill. Now I will start to use them more often. And drill down, yes it is very useful. It gives another very handy functionality into my reports.
M.