Unlock a world of possibilities! Login now and discover the exclusive benefits awaiting you.
- Qlik Community
- :
- Forums
- :
- Analytics
- :
- New to Qlik Analytics
- :
- Re: Y axis scale format
- Subscribe to RSS Feed
- Mark Topic as New
- Mark Topic as Read
- Float this Topic for Current User
- Bookmark
- Subscribe
- Mute
- Printer Friendly Page
- Mark as New
- Bookmark
- Subscribe
- Mute
- Subscribe to RSS Feed
- Permalink
- Report Inappropriate Content
Y axis scale format
I have a table with an expression for New Products as:
(Sum(total_inv_line_value*invnewproduct) > 1000000,
Money((Sum(total_inv_line_value*invnewproduct)/1000000), '£#.0m'),
Money((Sum(total_inv_line_value*invnewproduct)/1000), '£##0K'))
This provides me with the totals in thousands or millions.
I would now like to create a bar chart and apply these rules to my Y axis scale, however
I am not sure how to go about this.
Currently my scale shows as
0, 20, 40, 60 ...... ect.
I need this to be in thousands or millions.
Thank you in advance!
Accepted Solutions
- Mark as New
- Bookmark
- Subscribe
- Mute
- Subscribe to RSS Feed
- Permalink
- Report Inappropriate Content
If it's Qlik Sense you're using, Philip should have answered your question. Judging by your comment about 'expression default' I'm guessing it may be Qlikview you're using instead.
If so - you can't actually insert text into the y-axis. The best option is to use the built in Numeric symbol functions. On your Number tab, if you insert "K" into he Thousand Symbol and "M" into the Million symbol, Qlik will automatically switch between this symbol at the top of your axis and will scale the axis accordingly depending on the data selected. This is restricted to being above the column however, and so won't sit alongside every value - as far as I know, there isn't a way to do this.
P.s. - if this is Qlikview, you've accidentally posted in 'New to Qlik Sense'..!
- Mark as New
- Bookmark
- Subscribe
- Mute
- Subscribe to RSS Feed
- Permalink
- Report Inappropriate Content
Hi Phil
Thank you for your prompt reply! Greatly appreciated, however I am now getting:
0, 100, 200, 300....
I put the expression in but I couldnt find AUTO - currently set to expression default

- Mark as New
- Bookmark
- Subscribe
- Mute
- Subscribe to RSS Feed
- Permalink
- Report Inappropriate Content
Just so I'm clear are you doing this in QlikView or Qlik Sense?
- Mark as New
- Bookmark
- Subscribe
- Mute
- Subscribe to RSS Feed
- Permalink
- Report Inappropriate Content
Hi Emma,
Would this be if the values selected sum to one or the other? It wouldn't work to have an axis based on both, because it can't be two things at once, so would you want the axis to simply change when the values selected are above a certain limit? I.e. if the max value available is above a million, show the axis in millions, if not show in thousands?
- Mark as New
- Bookmark
- Subscribe
- Mute
- Subscribe to RSS Feed
- Permalink
- Report Inappropriate Content
Hi Aaron
Yes I would like that to be the case...
- Mark as New
- Bookmark
- Subscribe
- Mute
- Subscribe to RSS Feed
- Permalink
- Report Inappropriate Content
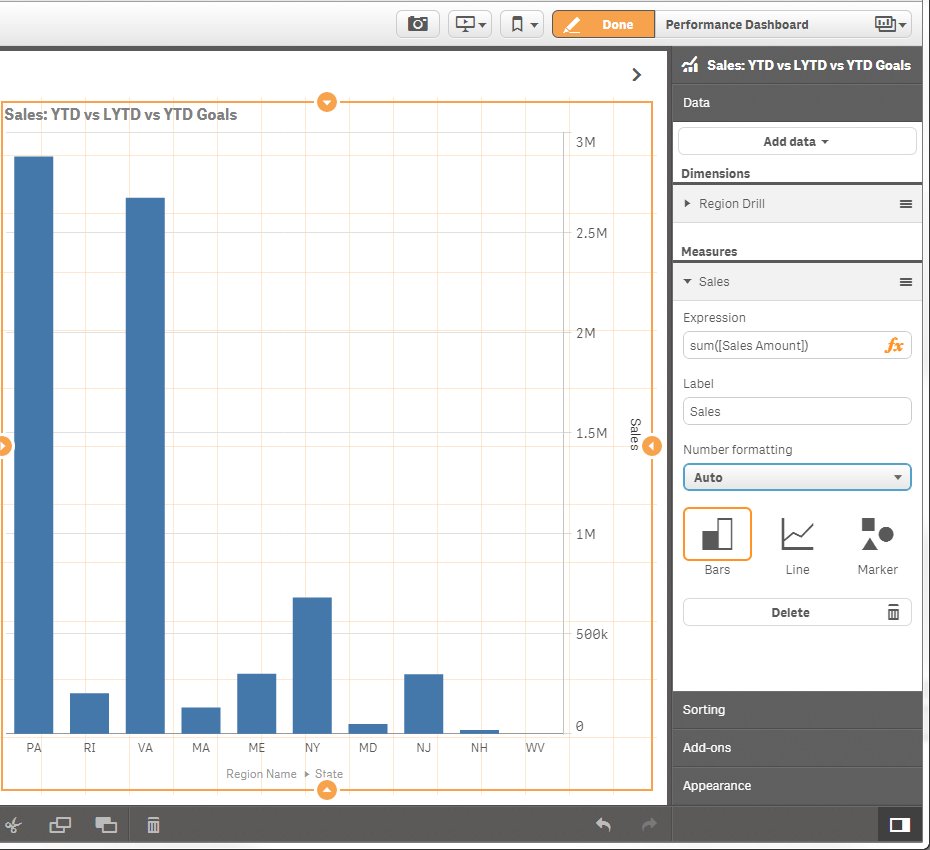
Check the Number Formatting is on AUTO by clicking on the measure.
In this case you should just be able to use a normal expression as shown in the image below.
Sum(total_inv_line_value*invnewproduct)
- Mark as New
- Bookmark
- Subscribe
- Mute
- Subscribe to RSS Feed
- Permalink
- Report Inappropriate Content
If it's Qlik Sense you're using, Philip should have answered your question. Judging by your comment about 'expression default' I'm guessing it may be Qlikview you're using instead.
If so - you can't actually insert text into the y-axis. The best option is to use the built in Numeric symbol functions. On your Number tab, if you insert "K" into he Thousand Symbol and "M" into the Million symbol, Qlik will automatically switch between this symbol at the top of your axis and will scale the axis accordingly depending on the data selected. This is restricted to being above the column however, and so won't sit alongside every value - as far as I know, there isn't a way to do this.
P.s. - if this is Qlikview, you've accidentally posted in 'New to Qlik Sense'..!
- Mark as New
- Bookmark
- Subscribe
- Mute
- Subscribe to RSS Feed
- Permalink
- Report Inappropriate Content
Thanks very much Aaron.
Apologies to all - Aaron is correct, I have posted to an incorrect area! 
- Mark as New
- Bookmark
- Subscribe
- Mute
- Subscribe to RSS Feed
- Permalink
- Report Inappropriate Content
Easy mistake to make 