Unlock a world of possibilities! Login now and discover the exclusive benefits awaiting you.
- Qlik Community
- :
- Forums
- :
- Analytics
- :
- New to Qlik Analytics
- :
- Year Over Year Change -- Qlik Sense
- Subscribe to RSS Feed
- Mark Topic as New
- Mark Topic as Read
- Float this Topic for Current User
- Bookmark
- Subscribe
- Mute
- Printer Friendly Page
- Mark as New
- Bookmark
- Subscribe
- Mute
- Subscribe to RSS Feed
- Permalink
- Report Inappropriate Content
Year Over Year Change -- Qlik Sense
I am new to qlik sense. I working with a table with the following column headers... Name, Year, Attendance. The years consist of 2011, 2014 and 2015... Attendance is a flag Y or N. I am looking to find the change in attendance from 2011 to 2014 and from 2014 to 2015. If 50 more people attended in 2014 then 2011 then I want it to show as a positive otherwise if it was 50 less people then it should show as a negative.
I am using the current expression, but it does not seem to be working.
(sum(If(Year='2011' and Attendance='Y',1,0))) - (sum(If(Year='2014' and Attendance='Y',1,0)))
It displays one positive bar graph for 2011 and a negative bar graph for 2014. I only want to see one bar either positive or negative.
Thanks
Accepted Solutions
- Mark as New
- Bookmark
- Subscribe
- Mute
- Subscribe to RSS Feed
- Permalink
- Report Inappropriate Content
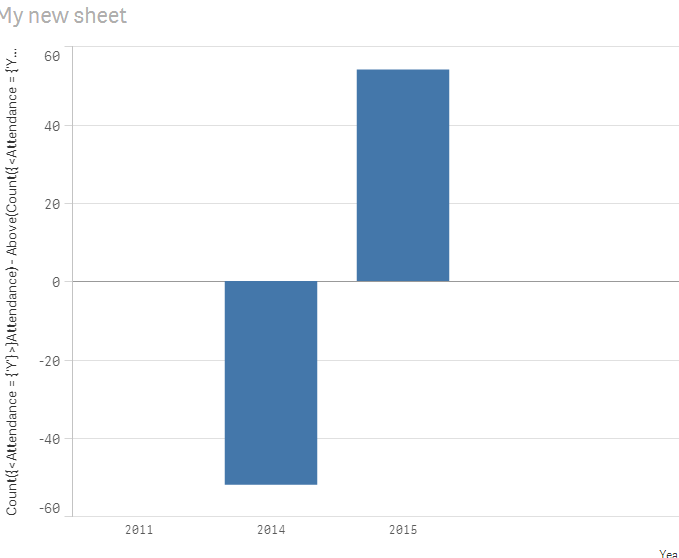
I guess you are right, since the years are not continuous, AsOfTable might not work. Try this instead:
Count({<Attendance = {'Y'}>}Attendance) - Above(Count({<Attendance = {'Y'}>}Attendance))
- Mark as New
- Bookmark
- Subscribe
- Mute
- Subscribe to RSS Feed
- Permalink
- Report Inappropriate Content
Try using the AsOf Table concept here:
- Mark as New
- Bookmark
- Subscribe
- Mute
- Subscribe to RSS Feed
- Permalink
- Report Inappropriate Content
I do not see how the As-of Table can be used with the way my data is structured. I attached a sample spreadsheet below. I am trying to show the change in attendance from 2011 to 2014 and from 2014 to 2015.
For example if 2011 attendance was 430 and 2014 went to 520 then there should be a bar graph showing 90.... If 2015 went to 480, then there should be a bar graph showing -40.
Thanks in advance for you help...
David
- Mark as New
- Bookmark
- Subscribe
- Mute
- Subscribe to RSS Feed
- Permalink
- Report Inappropriate Content
I guess you are right, since the years are not continuous, AsOfTable might not work. Try this instead:
Count({<Attendance = {'Y'}>}Attendance) - Above(Count({<Attendance = {'Y'}>}Attendance))