Unlock a world of possibilities! Login now and discover the exclusive benefits awaiting you.
- Qlik Community
- :
- Forums
- :
- Analytics
- :
- New to Qlik Analytics
- :
- Re: Year over Year % Change
- Subscribe to RSS Feed
- Mark Topic as New
- Mark Topic as Read
- Float this Topic for Current User
- Bookmark
- Subscribe
- Mute
- Printer Friendly Page
- Mark as New
- Bookmark
- Subscribe
- Mute
- Subscribe to RSS Feed
- Permalink
- Report Inappropriate Content
Year over Year % Change
I've been struggling to calculate % change between years/months so that it can change dynamically. I know how to hard code the years in, but want to see the % changes across multiple years. Here is an example of my data set:
| Month | Year | Value |
| 1 | 2015 | 4 |
| 2 | 2015 | 8 |
| 3 | 2015 | 5 |
| 4 | 2015 | 1 |
| 5 | 2015 | 6 |
| 6 | 2015 | 8 |
| 7 | 2015 | 4 |
| 8 | 2015 | 5 |
| 9 | 2015 | 8 |
| 10 | 2015 | 7 |
| 11 | 2015 | 4 |
| 12 | 2015 | 5 |
| 1 | 2016 | 5 |
| 2 | 2016 | 4 |
| 3 | 2016 | 8 |
| 4 | 2016 | 2 |
| 5 | 2016 | 6 |
| 6 | 2016 | 4 |
| 7 | 2016 | 1 |
| 8 | 2016 | 5 |
| 9 | 2016 | 6 |
| 10 | 2016 | 4 |
| 11 | 2016 | 2 |
| 12 | 2016 | 6 |
| 1 | 2017 | 4 |
| 2 | 2017 | 2 |
| 3 | 2017 | 6 |
| 4 | 2017 | 4 |
| 5 | 2017 | 2 |
| 6 | 2017 | 5 |
| 7 | 2017 | 1 |
| 8 | 2017 | 2 |
| 9 | 2017 | 7 |
| 10 | 2017 | 6 |
| 11 | 2017 | 5 |
| 12 | 2017 | 5 |
I currently have a pivot table on a sheet that looks like this using =Sum(Value)
| 2017 | 2016 | 2015 | |
| Value | 49 | 53 | 65 |
I'm trying to get to this without having to hard code the years into the set analysis formula:
| 2017 | 2016 | 2015 | |
| Value % Change | -8% | -23% | 0 |
Accepted Solutions
- Mark as New
- Bookmark
- Subscribe
- Mute
- Subscribe to RSS Feed
- Permalink
- Report Inappropriate Content
- Mark as New
- Bookmark
- Subscribe
- Mute
- Subscribe to RSS Feed
- Permalink
- Report Inappropriate Content
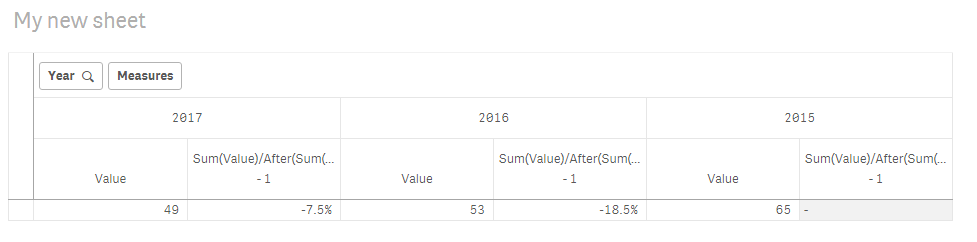
Try this
Sum(Value)/After(Sum(Value)) - 1
- Mark as New
- Bookmark
- Subscribe
- Mute
- Subscribe to RSS Feed
- Permalink
- Report Inappropriate Content
Hi Brittany,
Try this Just in Case.
Sum(Value)/ (Sum(Total Value))
Thanks
PM
- Mark as New
- Bookmark
- Subscribe
- Mute
- Subscribe to RSS Feed
- Permalink
- Report Inappropriate Content
Worked perfectly! Thank you!!!