Unlock a world of possibilities! Login now and discover the exclusive benefits awaiting you.
- Qlik Community
- :
- Forums
- :
- Analytics
- :
- New to Qlik Analytics
- :
- Year over Year comparison issue
- Subscribe to RSS Feed
- Mark Topic as New
- Mark Topic as Read
- Float this Topic for Current User
- Bookmark
- Subscribe
- Mute
- Printer Friendly Page
- Mark as New
- Bookmark
- Subscribe
- Mute
- Subscribe to RSS Feed
- Permalink
- Report Inappropriate Content
Year over Year comparison issue
Hi,
I want to display year over year comparison in bar chart for invitations and completions.
For this to happen, first i have created a CalendarMaster using Canonical Date. Then i have used below way
Dimension:Month
Measure:
prior year Invitation : count({<DateType = {invitation},Year = {"$(=year(max(CanonicalDate))-1)"} >}invitation_id)
Current year Invitation :count({<DateType = {invitation},Year = {"$(=year(max(CanonicalDate)))"}>}invitation_id)
prior year Completion :Count({$<DateType={completion},final_test_status={"passed"},Year = {"$(=year(max(CanonicalDate))-1)"}>}invitation_id)
Current year Completion :Count({$<DateType={completion},final_test_status={"passed"},Year = {"$(=year(max(CanonicalDate)))"}>}invitation_id)
My issue in this is that, as you can see below before January my bar graph was displaying with no issue by limiting it to 4 months.comparing for 2015 and 2016 data

But after completing December month and When January Started i am getting like below which is wrong and which should not be displayed like below. Here new year get started so new start month compare with 2016 and 2017.Problem is that its not tailing with previous year december month.Its start to compare next 4 months data.
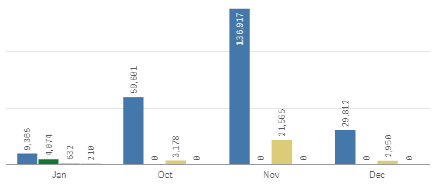
Requirement is this: After December month of previous year(as shown in first image)next year January data has to come. Here October ,november ,December has to compare for 2015 and 2016 data. next new year start of January(has to tail december of previous completed year) has to compare for 2016 and 2017 data in same bar graph with limit 4 month.
Please find below attached qvf file.
Please help me on this. If you need any kind of clarification you can ask and any kind of help is appreciated.
Regards,
Supriya