Unlock a world of possibilities! Login now and discover the exclusive benefits awaiting you.
- Qlik Community
- :
- Forums
- :
- Analytics
- :
- New to Qlik Analytics
- :
- Re: aggregate the sum of individual months for the...
- Subscribe to RSS Feed
- Mark Topic as New
- Mark Topic as Read
- Float this Topic for Current User
- Bookmark
- Subscribe
- Mute
- Printer Friendly Page
- Mark as New
- Bookmark
- Subscribe
- Mute
- Subscribe to RSS Feed
- Permalink
- Report Inappropriate Content
aggregate the sum of individual months for the yearly position
Hello,
relatively new to Qlik Sense but I've had experience with other tools. What I'm looking for is something similar to the SumX Dax expression.
When I use the following calculation my formula for the individual periods are correct (the part at the end is to account for year-end adjustments - 35 days in March) but ultimately the equation is looking to calculate the structural hedge that the business area will be paying which is driven by - Average Balance for that month * Bank Base Rate (0.75% when we actioned this forecast)
(((((Sum({$<Product={"Dummy Flex Hedging Op Bal","Flex Hedging Fixed Leg"}>}[Average Balance]))
*
(Avg(BBR)/100
*-1)
*Sum([Sheet1.DayCount]))/Sum([Sheet1.DaysInYear]))/Sum([Sheet1.DayCount])*Sum([Sheet1.Days])))
Period Amount
10 -£11,575,411.24
11 -£10,647,634.82
12 -£12,633,144.49
Grouped to yearly then gives : £34,881,060.37, when it should in fact be: £34,856,190.55
However when I then group the dimension up to the yearly position the total be different to the sum of the individual months.
The drilldown master item that I'm using is a combination of Year/Period.
I don't fully understand the Aggr function but I thought it would look something like:
Sum(Aggr((((((Sum({$<Product={"Dummy Flex Hedging Op Bal","Flex Hedging Fixed Leg"}>}[Average Balance]))
*
(Avg(BBR)/100
*-1)
*Sum([Sheet1.DayCount]))/Sum([Sheet1.DaysInYear]))/Sum([Sheet1.DayCount])*Sum([Sheet1.Days]))),Period)).
That unfortunately doesn't work and returns a value of 0 for both Period/Year dimensions. If I include Nodistinct into the expression as well the values go crazy.
Any help would be greatly appreciated!!!!!!
On a separate note, are Qlik looking into any capabilities of being able to reference master items in other master items? I don't fully understand how the variables work at this stage.
- Tags:
- aggr()
- Mark as New
- Bookmark
- Subscribe
- Mute
- Subscribe to RSS Feed
- Permalink
- Report Inappropriate Content
Do you have any dummy data that we can play with? And it also helps to see a dummy table of what you are expecting.
- Mark as New
- Bookmark
- Subscribe
- Mute
- Subscribe to RSS Feed
- Permalink
- Report Inappropriate Content
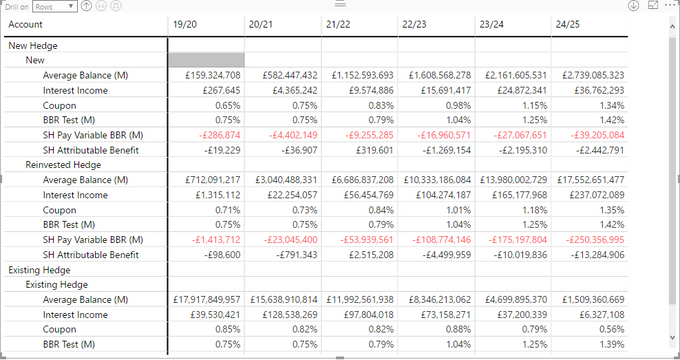
The below is using a SumX expression in power BI for the SH Pay Variable BBR (M) line, in which it calculates it for each individual period and then sums those values up to get the year end value.
Qlik is currently doing the following:
I can't provide sample data unfortunately, it's confidential data and there is quite a lot going on with the tables and associations. I'm pulling BBR from a separate table (scenario table) and using that to multiply with the average balance in the "master" table.
- Mark as New
- Bookmark
- Subscribe
- Mute
- Subscribe to RSS Feed
- Permalink
- Report Inappropriate Content
Solved the issue, I was just being a bit slow today....
Sum(Aggr(xxxxxxxxxxxx, Enddate, Dim1,Dim2) was all I needed to change and it worked fine 🙂
Thanks for taking the time to help though!
- Mark as New
- Bookmark
- Subscribe
- Mute
- Subscribe to RSS Feed
- Permalink
- Report Inappropriate Content
Great ! For future reference, here is an example where I provide dummy data to help the Qlik community help me.

